

 Print
Print It’s surprising how worries come and go. Not that long ago, there was a real fear that China could—by dumping its vast store of U.S. Treasury bonds on the market—drive rates up and cripple the U.S. economy. As China’s economy has weakened, however, we haven’t heard so much of that, and worries have shifted to other ways that China could tank the world economy. But, in fact, could this be a more serious issue now than it was then?
With China needing the money, potentially, it might indeed sell U.S. Treasuries and other assets to raise cash. China might not mean to tank the market, but it could happen anyway. I have had several advisors ask about this as the issue has started to hit the media, and it’s worth taking a serious look.
A closer look at interest rates
First, let’s look at the way interest rates have evolved over the past year. If there was more selling than buying, we should see rates rise. As you can see in the chart below, rates have actually declined over the past 12 months. If China is dumping U.S. bonds, there must be a large number of buyers that are mopping them up and asking for more.
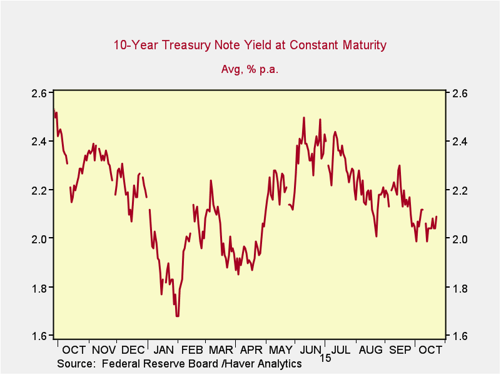
Second, let’s look at rates over the specific time period that China would have been selling. This first hit my radar last July, when an advisor sent an article to me that stated, more or less plausibly, that China had sold $150 billion in Treasuries in the first half of the year. If you look at the chart above, if in fact China had sold about $150 billion in Treasuries in the first half of the year, then that drove rates up from about 1.7 percent to about 2.5 percent, an increase of 80 basis points. You could argue that China’s selling did increase rates over that time period, but rates appeared to have topped out at 2.5 percent. I wrote then that, with that level of existing sales, it would take a substantial increase in Chinese selling above that level to drive rates significantly higher than that.
Are Chinese sales behind the rise?
This all assumes that the rate rise was due to Chinese sales. There are, however, multiple other reasons that rates could have risen. Because rates dropped in the second half of the year, one way to determine whether China was responsible is to examine whether the sales stopped in the second half of the year, leading to the decline in rates.
Judging by the data, Chinese sales continue. According to its own central bank, foreign exchange reserves dropped by almost $100 billion in August, quite a bit of which very probably came from U.S. Treasury stocks. This is well above the monthly pace of sales reported for the first half of the year. But in August, interest rates remained relatively stable, even dropping at one point. This suggests that other factors may have driven rates to rise in the first half of the year—and that even if Chinese selling were behind part of the rise, the market has adapted to it. Therefore, even if China were to continue selling at that pace, there appears to be no reason for rates to go higher again unless the pace accelerates.
Even if that were to happen, sales at that higher rate would be quite limited in time: What was sold in August is potentially about 7 percent of what China has left; to continue selling at that pace would unwind its entire position in pretty short order. Not only that, China can’t sell everything, as it needs the dollar asset liquidity for trade. In other words, the doable damage has largely been done and accommodated by the market: Chinese selling can’t push that much harder unless it really panics and starts dumping stuff, which there are no signs of at the moment.
What about the buyers?
Finally, you could also argue that if, somehow, the buyers that so far have picked up the excess supply were to disappear, rates could rise. As a benchmark for that, we could take the increase in the first half of the year, 80 basis points, and apply it to current rates, to get an upper range of about 2.9 percent. This is not good, certainly, but right about where we were at the start of 2014—so no disaster either. I don’t think this is probable, but as a reasonable worst-case scenario, it’s still not bad.
So, what’s the damage?
In summary, it appears that China has been liquidating large portions of its Treasury holdings but that the damage, if any, to U.S. rates has been modest and well contained. It also suggests that the likelihood of substantial future damage is not that high. As China rebalances its economy, this is both a necessary and, ultimately, a healthy step for itself, the U.S., and the world. It is also one more example of something heralded as a potential disaster that turned out to be nothing of the kind.


