

 Print
Print Today’s post is from Brian Price, Commonwealth’s senior vice president of investment management and research.
Much has been made of the recent proliferation of ETFs and the seemingly endless fee war taking place among the providers of low-cost index funds. As a self-described value guy, I love the fact that advisors have the choice of populating client portfolios with cheap beta through passive vehicles that, for the most part, are very tax efficient. In fact, cost and tax efficiency are the two main reasons why I am a firm believer that ETFs and index mutual funds should absolutely be part of the conversation when constructing portfolios.
I am less convinced, however, that passive investments should always be selected over actively managed mutual funds for reasons related to performance. While there are certain market environments that have historically favored passive over active, I think we need to be mindful of the fact that the reverse can also be true.
The rise of the active manager
Admittedly, it would have been challenging to make this acknowledgment a couple of years ago when we were in an environment that decidedly favored passive. It was hard to find many equity or fixed income asset classes where the median active manager had outperformed its respective index over a one-, three-, and five-year basis near the end of 2016.
Since the election in November 2016, however, we have seen a fairly dramatic improvement in the relative performance of active equity and fixed managers. In most of the major domestic equity style boxes, there has been an improvement in the percentage of active managers beating their respective benchmarks compared with the three- and five-year periods preceding the election (see chart below). The only exception is small-cap growth, where active managers experienced a strong period of outperformance in the 12 months leading up to November 2016.
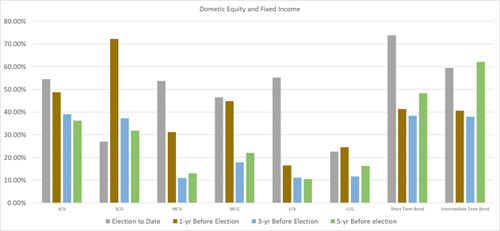
Source: Morningstar® Direct, Commonwealth
A similar story unfolds when we look at the performance of active fixed income managers, as noted in the above chart. While their longer-term performance was more inspiring leading up to the election, both the short-term and intermediate-term bond categories have seen impressive relative performance since the election—with approximately 60 percent to 70 percent beating their respective indices.
The time period chosen for this analysis is relatively short (and somewhat arbitrary!). But it is worthwhile to evaluate the market environment during this time to see if it helps with the decision of favoring active management moving forward. Is there anything in particular about the past two years that investors can extrapolate to determine optimal active/passive exposure across their portfolios?
The role of interest rates
One of the largest elements that has defined the past two years has been the steady rise in interest rates. The chart below shows the yield of the 10-year U.S. Treasury bond from October 2016 through August 2018. Active fixed income managers have been particularly successful in this most recent environment due to a variety of factors, including their decision to shorten up duration and/or increase exposure to “credit-sensitive” securities offering higher yields than U.S. Treasuries.
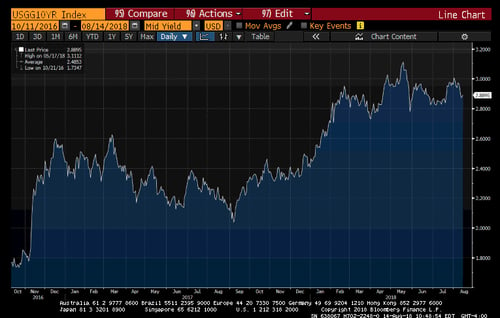
Source: Bloomberg
This dynamic is also relevant when evaluating the domestic equity landscape over the past two years. Interest rate-sensitive sectors (e.g., utilities, telecom, and real estate) have been under pressure during this time period. Concerns about valuations, sensitivity to rising interest rates, and underwhelming growth prospects in heavily regulated sectors like utilities are some of the reasons why active managers have been underweight in these areas as of late.
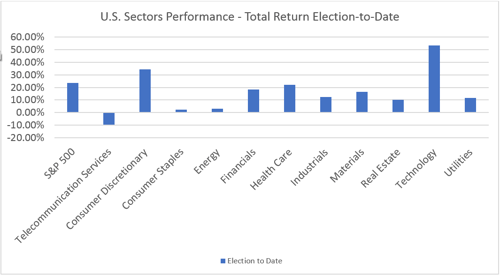
Source: FactSet
Alpha plus beta
Investors typically allocate to passive investment vehicles because they want broad market exposure in a way that is tax efficient and inexpensive. While there are now index mutual funds that are free, we should not ignore active managers and their quest to exploit market inefficiencies across asset classes. Consider both to take advantage of the best that alpha and beta can provide when combined in a portfolio.


