

 Print
Print Brad here. Over the past couple of weeks, I have been mentioning that I thought there’s a risk of a “heating” wave of the pandemic this fall in the northern states, following the “air conditioning” wave we saw in the southern states this past summer. I discussed it as a reasonable risk and something to keep an eye on, but my colleague and friend Pete Essele has gone well beyond that and done the work here to establish in detail both what happened over the summer and what that could mean for the fall and winter. Definitely worth a read! Great job Pete and thank you.
As many of you know, I’m a numbers person. Much of what I discuss on this blog or during in-person presentations is rooted in some level of data-based research. I love data because it often informs good decision-making. In my role, I’m tasked with identifying trends in the data—economic and financial—to extract useful pieces of information for our advisors and their clients.
Over the past 18 months or so, I’ve spent a fair amount of time (much to the dismay of my wife) analyzing COVID data, hoping to tease out identifiable trends and patterns to explain outbreaks. Specifically, I’ve been intensely curious as to why cases spike in one area of the country and fall in others. After all, we live in a mobile nation with fluid access across state lines and regions. Why, then, were case bursts occurring regionally and at different points? I ran large sets of data and countless scenarios that looked at how different inputs contributed to regional COVID case numbers. Data sets included, but were not limited to, population density across states and counties, social distancing protocols, weather patterns, and vaccine rates. The following details a segment of that research.
The Weather Effect
It’s become evident through the months of data research that one of the largest determinants in the COVID case numbers has to do with a simple input: weather. More specifically, it has to do with human behavior during weather patterns and when individuals spend time congregating indoors. In the North, individuals assemble indoors during winter months for heat; in the South, people do so in the summer for air conditioning. Indoor gathering, as we all know, is a significant contributor to COVID infections and outbreaks.
To understand how weather patterns affect COVID cases, we can look at case counts per capita in August across all 50 states. In the chart below, the states are sorted from warmest summer temperature to coolest, left to right. Note that the highest case count ratios, on average, occurred among the warmest states on the left-hand side.
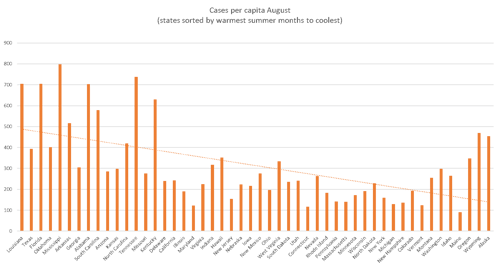
Source: Centers for Disease Control and Prevention
The preference for indoor habitation in air-conditioned climates during the summer months across many states in the South undoubtedly contributed to greater COVID transmission and higher rates, all else being equal. Conversely, northern states (e.g., Maine, Vermont, and New York), which typically see the populace engaging in outdoor activities during the summer months, had very low case rates.
Recently, however, the trend has started to change, where cooler states are now experiencing the highest case rates, on average. As shown in the chart below, states are sorted left to right by coldest to warmest fall temperature. Note that states associated with the mildest fall temperatures have the lowest case rates, on average.
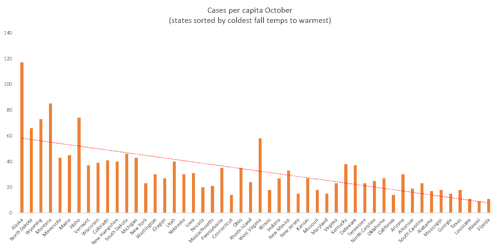
Source: New York Times
The populace in northern states is now beginning to shelter indoors as temperatures drop toward freezing, which is contributing to an uptick in transmission and infections. Vermont, for instance, with the highest vaccine rate in the country, is seeing case rates above the national average, while low-vaccine-rate states like Mississippi and Louisiana have some of the lowest cases per capita. The reason for the flip-flop in case rates from August to October across regions is that autumn brings cooler temperatures across the South, and individuals begin to emerge from their air-conditioned hibernation. Transmission rates dropped as a result, and they’ve now begun to increase in the colder North.
Florida as a test case. Florida is probably the best state to make the case for weather-related effects on COVID cases. It has oppressively hot summers where the populace shelters in air conditioning to escape the heat, and it has very mild autumns that cater to outside activities. During the summer of 2021, Florida COVID cases soared. At one point, the state accounted for roughly one-quarter of outstanding cases in the U.S., despite having a vaccine rate above the national average. Currently, though, as temperatures have become milder in the state, it is exhibiting one of the lowest per capita case rates. The same trend occurred in 2020, where cases soared during the early summer months then subsequently collapsed as temperatures cooled through the fall.
Weather trends in Europe. If we analyze weather patterns and COVID cases across Europe, a similar pattern emerges. Colder climates (especially former Eastern Bloc countries) are seeing an increase in COVID cases, while warmer climates (Portugal, Spain, and Italy) are experiencing a decline. The latter countries saw a spike in July and August, and now case counts remain relatively low. Therefore, the trends in Europe look very similar to the situation playing out in the U.S, and it seems reasonable to assume that we will see infections increase in the months ahead in cooler-climate states domestically.
Declining Vaccine Effectiveness?
An additional component to consider is that vaccine effectiveness against infection declines as time passes from vaccination. According to a study funded by Pfizer that was published in the Lancet, the Pfizer–BioNTech vaccine’s effectiveness against Delta-variant infection declined from 88 percent during the first month after full vaccination to 47 percent after five months. (The effectiveness against hospitalization, however, remains at 93 percent up to six months!) Considering that a good portion of the colder-climate population received the two-dose series in April and May, we’re now entering a period where vaccine effectiveness is beginning to drop below 50 percent for early recipients (in many states, those are the most vulnerable), right as people begin sheltering and congregating indoors to escape the cold.
Vermont as a test case. Vermont will be a good test case for waning vaccine effectiveness occurring with the onset of colder months. The state was very quick to vaccinate a large portion of the population early in the pandemic, where 70 percent of the population received at least one dose by June 1. It also means that it’ll be one of the first cooler-climate states to experience waning vaccine effectiveness as people shift indoors. A continued rise in Vermont cases may be the canary in the coal mine.
The Investment Implication
If we see a rise in infections in the months ahead, there’s a very real possibility that northern states will respond with shutdowns. Unlike southern states that remained largely open during summer flashpoints, northern states are more apt to implement shutdowns to curb an outbreak, as witnessed by the actions performed during the pandemic.
If cases continue to rise and shutdowns ensue, there will most likely be a knock-on effect on the economy and markets. In that case, cyclically oriented value stocks will most likely come under pressure, and investors may want to consider shifting some proceeds to take advantage of discounted prices. On the other hand, if the social appetite for lockdowns is no longer there and pressure builds to remain open during a case spike, investors would probably want to consider growth-oriented exposures to capitalize on the current momentum.
Where Do We Go from Here?
While we’d all love to wake up one day and discover that COVID has disappeared, the reality of the situation is that it’s most likely here to stay. The virus’s ability to mutate into more contagious variants and the waning effectiveness of vaccines against infections as time progresses suggest that case spikes will occur with regularity. As I outlined above, it’s likely that they’ll become a seasonal phenomenon, much like the flu.
For the vaccine-inclined among us, booster shots will probably become as commonplace as the flu shot. While they don’t ensure complete immunity against infection, vaccines have proven to be an effective deterrent to severe infection and COVID-related trips to the hospital. In many cases, breakthrough infection symptoms have been relatively mild compared to those occurring in unvaccinated individuals.
The best approach moving forward is to stay safe, stay healthy, and protect those around you. We’re better together.


