

 Print
Print Today's post is from Jim McAllister, director, equity research.
Since stocks bottomed on March 23, 2020, after the COVID-driven sell-off, domestic equities have posted very strong returns. In fact, the Russell 1000 Index is up by almost 86 percent through the end of Q1 2021. But when you break it down by investment style? It’s been a tale of two markets.
The first phase was driven by growth stocks from the bottom in March 2020 through September 2, 2020. As you can see in the chart below, the Russell 1000 Growth outperformed its counterpart by more than 30 percent in this brief span.
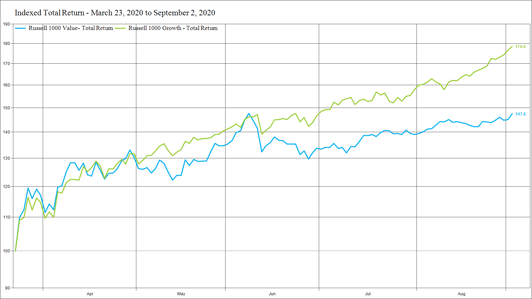
Source: FactSet
But starting in early September 2020, the tide began to turn. Value stocks took on a leadership role, outperforming growth stocks by nearly 20 percent through the end of March 2021.
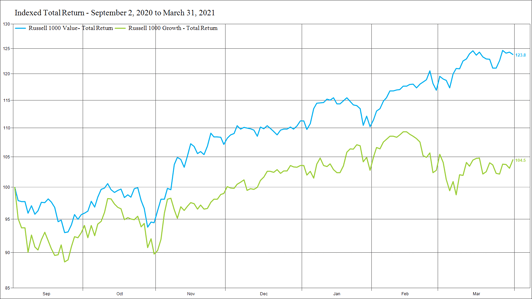
Source: FactSet
So, where do we go from here?
Finding Opportunity in Value Stocks
While the chart above shows how value stocks have finally had their day in the sun, the fact remains that growth has trounced value since the end of the financial crisis in 2009. In that time, value stocks twice outperformed growth consistently for more than a year: from May 2012 through July 2013 and what was basically calendar year 2016. The question is, will this recent value leadership have legs that can extend beyond a year, or will it fade the way of Cinderella once the clock strikes 12 (months)? While it’s impossible to predict these outcomes with certainty, there are several identifiable tailwinds that could keep this value rally going.
Economic growth. The primary underlying factor for strong value stock performance is economic growth because many value-centric sectors are economically sensitive. While expectations are for a monster year of GDP growth in 2021, it’s not clear whether momentum will stall in 2022 or continue for several more years into what some prognosticators predict could bring about a boom akin to the roaring 1920s. In other words, value stocks will likely require more catalysts if there is hope for an extended period of outperformance.
Fiscal policy. This brings us to fiscal policy, which has the potential to serve as the next tailwind. The Biden administration has signaled it intends to push significant stimulus programs, including an aggressive infrastructure plan that will cost in the trillions of dollars. This plan goes beyond the short-term shot in the arm that comes from other tools (e.g., extended unemployment and stimulus checks), as infrastructure projects take years to complete yet provide more sustained support of economic growth. On the monetary side of the house, the Fed has indicated it will continue to accommodate economic growth by keeping rates low. That said, fixed income markets are already anticipating more prolonged economic growth and perhaps even inflation as 10-year Treasury bond yields have increased from 60 bps to 1.70 percent over the past six months.
Industrial and materials companies. With that backdrop, there are several sectors and industries prominent within value indices that could see revenues and earnings thrive. While the exact details of an infrastructure bill are not known, improvement to things like roads, bridges, rails, airports, and ports is expected to be well represented. These projects require investment in heavy equipment like dump trucks, bulldozers, excavators, and cranes, as well as building blocks like cement and steel. Industrial and materials companies that manufacture those goods will likely be immediate beneficiaries. But longer term, the improved infrastructure will also benefit additional end markets such as the airlines, airfreight companies, rails, and trucking-related industries thanks to improved operational efficiencies.
Financial sector. And while higher 10-year yields might represent a red flag for some sectors, they are a significant tailwind for the financial sector, which happens to make up nearly 20 percent of the Russell 1000 Value. Higher interest rates allow financial companies, banks in particular, to charge higher interest rates on loans they underwrite at a faster pace than what they pay on deposits. In that scenario, financial companies can earn much higher profit margins in a higher rate environment. Not only that, but banks benefit from prolonged economic expansion because there is more demand for loans.
There is no doubt that the recent strength in value stocks has led to increased valuations. But if these tailwinds do come to fruition, there is the potential for select value sectors and industries to experience a multiyear cycle of above-average revenue and earnings growth relative to the rest of the market. Under that scenario, there is a much greater probability that those areas of the value style could outperform the overall market.
Finding Opportunity in Growth Stocks
Finding opportunity within the large-cap growth style might appear a bit daunting at first, given that certain prominent areas of the value market could experience several years of superior earnings growth. In addition, it’s not like growth stocks are cheap after the Russell 1000 Growth increased 87 percent in one year’s time (trailing 12-month return), pushing valuation multiples to well over 30x expected earnings over the next 12 months. Taking these headwinds into consideration, it’s not exactly the kind of backdrop that screams opportunity. Yet, once again, we believe that if you look below the surface, opportunities can be found.
How did we get here? To get a better feel for where opportunity may lie, we need to start with an understanding of how we got where we are today. The charts below break down the top 10 contributors to the Russell 1000 Growth (when growth outperformed off the March 2020 bottom) and the bottom 10 contributors to the index (when growth underperformed value from September 2, 2020, through Q1 2021). In the early days of the recovery, the mega-cap tech-related stocks, which make up more than 40 percent of the index, also contributed 36 points to the index (or 45 percent of the index total return) and averaged almost 100 percent returns. But when we shift the time frame to September 2, 2020, through Q1 2021, we see an interesting transition in market leadership. In that second time period, 4 of the names that had been top 10 contributors in the first part of the recovery (Apple, Amazon, Facebook, and NVIDIA) were now in the bottom 10 and detracted from index performance. It’s also worth noting that 2 of the top 10 (Tesla and Alphabet) remained top contributors.
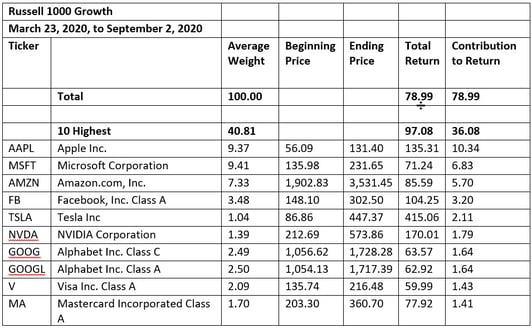
Source: FactSet
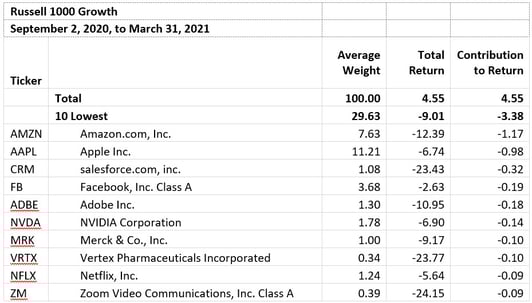
Source: FactSet
What took place within the growth market was a shift to more cyclical names (e.g., electrical and traditional vehicle manufacturers, internet stocks that rely heavily on advertising). At the same time, investors moved away from more secular growth names that represented relative safety in the early stage of the recovery. But a lot of those “safe haven” names that investors ditched still represent very intriguing secular growth opportunities with attractive fundamentals thanks to consistent increases in earnings expectations, and they are now trading at much more reasonable valuation ratios.
GARP stocks. As a result, we believe one area where there could be potential opportunity in growth is within the mega-cap names that have lagged over the past six months but are now trading at reasonable prices. These growth at a reasonable price (GARP) stocks may not be the darlings of the Robinhood crowd or short-term momentum traders anymore, but that may just be the perfect reason for longer-term investors to seek them out.
Semiconductor space. One industry that currently meets the GARP criteria is select semiconductor names where multiple secular growth drivers like 5G, data centers, cloud technology, and vehicle electrification have resulted in a global shortage of semiconductor chips. The strong end-market trends, combined with the shortage, build a foundation for strong multiyear order cycles for both semiconductor manufacturers and semiconductor equipment companies, as capital spending budgets are on the rise to satisfy demand. Valuations may look a little expensive if you’re looking forward only one year, but semiconductor cycles typically play out over several years, leaving a lot more time for earnings to run.
Health care. Another good example of current opportunity is the health care sector, where a variety of dynamics could drive several years of secular growth. For the pharmaceutical and biotech names, COVID-19 has served as a stark reminder of how unprepared the world was for such a pandemic. In turn, this is driving higher levels of investment so that health care workers are better equipped for future waves of COVID or even a completely different type of pandemic. Additionally, medical device companies are poised to see a long wave of demand as a year of delayed elective procedures needs to be addressed once hospitals are no longer overwhelmed with COVID-related cases.
So, while growth stocks might not look appealing at the index level based on valuations after a year of incredible performance, there may still be some pockets of select growth stocks that could deliver strong relative performance over the coming year and beyond.
Not an Either/Or Question
As we think about what’s in store for the rest of 2021 and beyond, the questions of whether growth names will come back in vogue or whether value stocks will continue to outperform are valid. But as we can see when we do a little digging, it doesn’t have to be an either/or question. Instead, there will be compelling areas of opportunity in both growth and value as the economy continues to open up.


