

 Print
Print My post last week on this topic generated a fair amount of attention and quite a bit of comment, both positive and negative. I stand behind my argument, but one excellent question came up that’s worth addressing: what does the data show during a period of rising rates, such as the 30 years before 1985 (the starting point for the data in my previous post)?
Over the next couple of decades, it’s quite possible we will see rates rising again. Why not take a look at the last time that happened?
Interest rates and stock performance: 1954–1984
Let’s consult the data, using the same 30-month lag as we did in the previous post. I had an idea about what the relationship would look like—almost the exact opposite of what we saw for the past 30 years—but I was surprised at the strength of it.
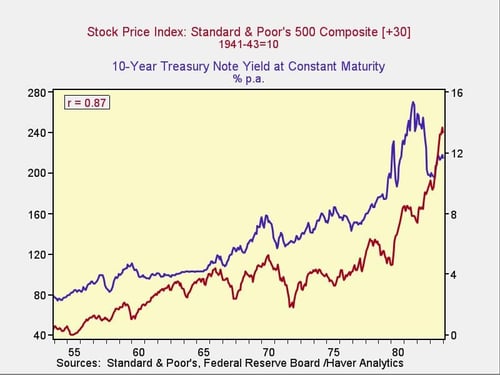
The chart above shows very clearly a positive correlation between rising interest rates and rising stock prices. Based on this data, rising rates mean higher stock prices, not lower. Moving back and forth in the analysis, the balance point (where interest rates have zero net correlation) is around 1980—right about the time that Paul Volcker hiked rates in order to control inflation, creating the conditions for the long subsequent decline.
What does this tell us?
This analysis actually reinforces the conclusion of my prior post—that there is no direct relation between interest rates and stock prices. Rather, it all depends on the balance between those rates and other factors, notably growth. Beginning in 1954, we saw nearly three decades of rising stock prices along with rising rates. Once again, a rise in rates does not mean a collapse in stock prices.
Of course, it’s not quite that simple. We can argue about growth and other factors. And, to be clear, I’m not saying that rising rates are good for the stock market, just that they’re not necessarily bad for it. Any analysis that looks only at the absolute level of interest rates, without taking at least inflation and growth into account, will be incomplete.
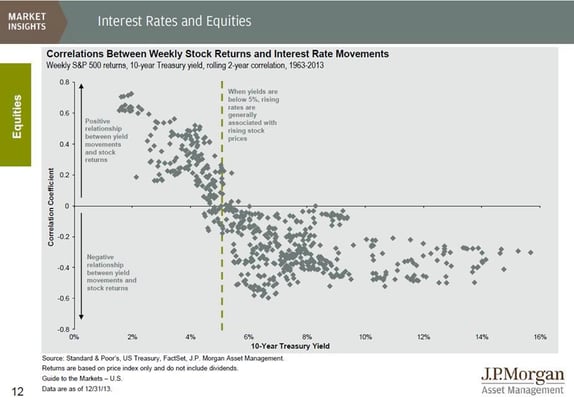
Other analyses I’ve seen and done have correlated stock market prices to where interest rates are with respect to a balanced level, typically around 4 percent to 5 percent. This chart from J.P. Morgan makes the point very clearly. This data is also consistent with what we’ve seen in the two 30-year periods we’ve examined.
Summing up
The stock market can climb during long-term trends of both rising and falling interest rates, suggesting there is no single controlling relationship. Over shorter time frames, the market seems to rise when rates are approaching a natural level of around 4 percent to 5 percent, and fall when they are moving away from it.
Why? The fundamental reason seems to be that rising rates are healthy when they reflect a growing economy, as they have tended to do up to about 5 percent, but unhealthy at levels above that.
Today, with U.S. rates rising but still well below the critical level—and rising in response to an improving economy—history suggests this isn’t necessarily bad for stock prices and may, in fact, be good.


