

 Print
Print Today’s post on the recent strong performance of growth stocks comes from Brian Price, senior vice president of investment management and research here at Commonwealth. Over to you, Brian!
Earlier this month, I enjoyed a socially distanced round of golf with a couple of friends, and the conversation inevitably turned to the stock market. One of my compadres is a self-admitted novice when it comes to investing and prefers to keep his portfolio allocated to a series of low-cost passive products designed to track broad indices like the S&P 500. This is a sensible strategy for sure, as he typically spends as much time researching investments for his portfolio as he does on his golf game (i.e., not much)!
Fortunately, my friend’s low-maintenance approach to managing his 401(k) has yielded fairly good results as of late. After the shock and horror he felt after looking at his portfolio statement on March 31, he was pleasantly surprised to see that his account balance was back to where it was at the start of the year by the time his June 30 quarterly statement had arrived in the mail.
A look under the hood
The S&P 500 is modestly positive for the year as of this writing, but a look under the hood shows that this index has been far from boring thus far in 2020. The U.S. equity market has increasingly been driven higher by a narrow universe of stocks that, fortunately for investors in index-based products, are represented in the top 10 holdings. The narrow “breadth” of the market is illustrated in the chart below. It shows a record number of index constituents underperforming the S&P 500 by more than 10 percent, along with a record low 22 percent of stocks outperforming the index.
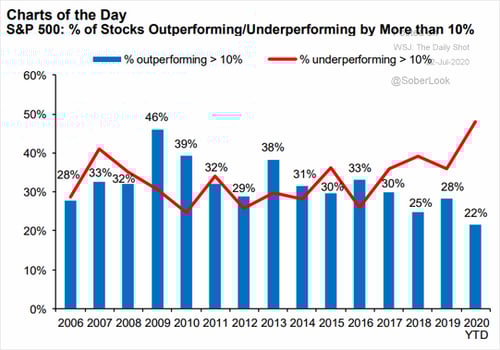
Source: The Daily Shot, Wall Street Journal
What’s driving the market?
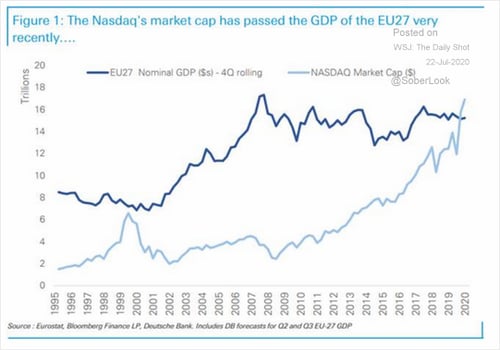
Perhaps the worst-kept secret of what has been driving the market this year is the fact that the technology sector—along with consumer bellwether Amazon (AMZN)—has been on a tear. The magnitude of this drive may surprise some investors, especially when they learn that Microsoft’s (MSFT) market cap is approaching that of the U.K.’s entire FTSE 100 Index or that the Nasdaq market cap is now exceeding the GDP of the entire EU (see chart below).
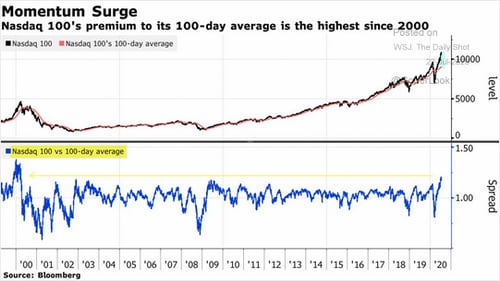
To drive home the point of just how strong the momentum has been with the tech-heavy Nasdaq index as of late, just take a look at the chart below. Moving averages are a great gauge of relative strength. We are approaching levels today that were last seen during the dot-com bubble at the turn of the century.
Will history repeat itself?
The period after the dot-com bubble (2000–2002) was certainly not kind to investors in the Nasdaq, but there are notable differences today that could result in history not necessarily repeating itself. Many of the internet and tech stocks that garnered such a frenzy in the late 1990s had very little or negative earnings, and valuations were beyond extreme. Growth at a reasonable price was replaced with growth at any price, as retail investors piled into anything with “.com” in its company name.
Stocks like Apple, Microsoft, and Amazon are all typically labeled as growth stocks, just as internet stocks were in the 1990s. But these companies are also continuing to deliver solid earnings reports on a quarterly basis. Time will tell if those growth rates will justify what investors are willing to pay for their shares today, but the signs of valuation excess do not appear as rampant today as they were 20 years ago.
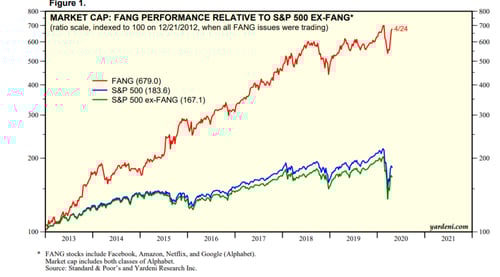
It is important to note, however, that the bar has been set higher for these Nasdaq darlings given their recent period of strength. The infamous FANG stocks (i.e., Facebook, Amazon, Netflix, Google) have delivered outsized returns since they all started trading. But it might be reasonable to believe that their magnitude of outperformance may be difficult to sustain in perpetuity. Any sustained rotation into cyclically oriented value stocks could result in a reversion to the mean for some of these Nasdaq highfliers, and future returns may be disappointing for those who have recently purchased exchange-traded funds (ETFs) that track the index.
Concentration matters
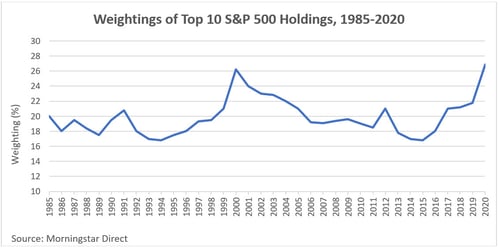
The significant rally in the top holdings in the Nasdaq 100 Index also has implications for broader indices like the S&P 500. Currently, the top three stocks in the widely followed S&P 500 are Microsoft, Apple, and Amazon, with an aggregate weighting of approximately 16 percent. Add in the rest of the top 10 index holdings, and the total weighting of these constituents is more than 26 percent of the entire S&P 500. This is a level of concentration not seen since the dot-com bubble in 2000. Gulp!
There has been a large movement out of actively managed mutual funds and into passively managed products like ETFs and other index funds. These products have a number of advantages, like tax efficiency and low cost, and they should always be part of the consideration when constructing a portfolio. Investors in index products that are designed to track the Nasdaq and S&P 500 should be mindful, however, of current sector and security weightings of these popular benchmarks. They are somewhat top-heavy as of this writing, with stocks that have performed extremely well over the past few years.
A good exercise for clients to periodically perform is to review their overall asset allocation and focus on the resulting sector exposure. You may have a portfolio that appears balanced at first glance, but a deeper analysis of sector allocation could show a much higher weighting in certain areas and individual securities than otherwise may be preferred. This is especially true today as a result of the market’s narrow breadth and significant share price appreciation of top holdings in indices like the S&P 500.
The trend is your friend (for now)
Markets generally follow cyclical patterns, and the duration of these periods can vary over time. We have been in a prolonged period of strong performance from growth stocks and, more specifically, the information technology sector and consumer companies like Amazon. The trend is your friend for now, but investors should be mindful of the exposures across their portfolios and ensure that they are properly diversified when the current cycle turns.


