

 Print
Print Heading into 2023, a looming recession dominated the headlines. Moody’s Chief Economist Mark Zandi quipped at the time, “CEOs are falling over themselves to say we’re falling into a recession. . . . Every person on TV says recession. Every economist says recession. I’ve never seen anything like it.” Fast-forward to today at the midyear point of 2023, and the data is telling a different story.
Inflation has fallen by 2.5 percent, more than 1.8 million jobs have been created in the past six months, and the S&P 500 has had one of its best starts in 25 years. Many investors are now asking, what happened to that recession? Let’s take a look back at how we got here—and what we can expect for the rest of the year.
Strong Start to 2023
Although many economists were firmly in the recession camp at the close of 2022, Commonwealth’s Investment Management team foresaw a Goldilocks economy (i.e., an ideal state with full employment, economic stability, and stable growth) and believed there were tailwinds for growth.
Indeed, we did see a very strong first half. And there’s reason to believe that the tailwinds will continue to blow through year-end, specifically those related to inflation, employment, and the consumer.
Inflation: Prices Stabilizing
Inflation was a contributing factor to consumer and investor skepticism in 2022. But over the past 12 months, it has continued to moderate toward the Fed’s mandate of 2 percent (see chart below). Prices on common expenditure areas like butter, milk, and gasoline have declined 20 percent, 34 percent, and 36 percent, respectively, over the past year.
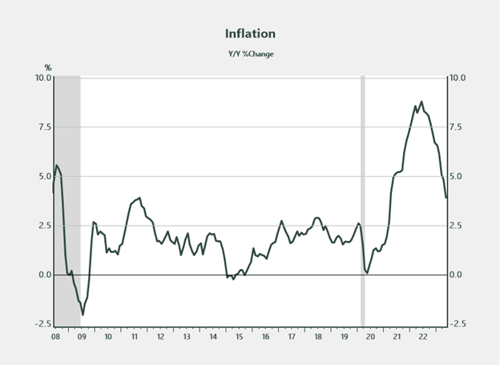
Source: Bureau of Labor Statistics, Haver Analytics
Overall, inflationary pressures should continue to moderate in the coming quarters as supply-demand dynamics balance. The result should be a reprieve for Americans at the pump, grocery stores, and elsewhere, ultimately putting more money back in the consumer’s pocket.
Employment: Labor Demand and Wages Growing
Over the past 12 months, the economy has added 4 million jobs, with approximately 40 percent of those gains occurring in the first five months of 2023 (see chart below). The mismatch between labor demand and supply is the largest on record, with 10 million job openings compared to only 5.7 million unemployed.
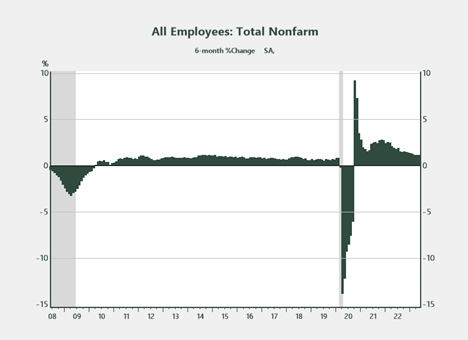
Source: Bureau of Labor Statistics, Haver Analytics
This strong demand for labor has resulted in above-average wage growth, especially for those in lower-skilled occupations (see chart below). After years of lackluster wage gains, many individuals are now seeing more dollars in every paycheck, which is contributing to the spending patterns experienced as of late.
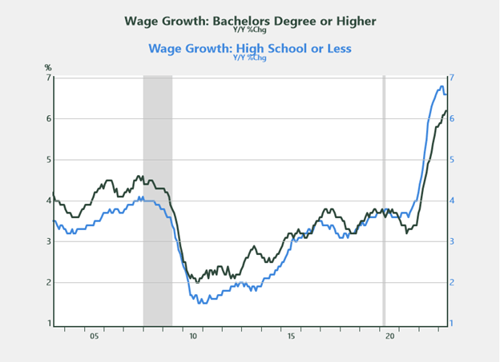
Source: Federal Reserve Bank of Atlanta, Haver Analytics
Consumers: Spending Rising, Savings Falling
With more dollars in every paycheck, consumers are spending. Plus, they’re doing so at a pace that’s above historical norms, as evidenced by the decline in the personal saving rate in recent periods. Since the pandemic, Americans have been on a spending spree, which began with purchases on goods and has since moved toward services like leisure, travel, and hospitality.
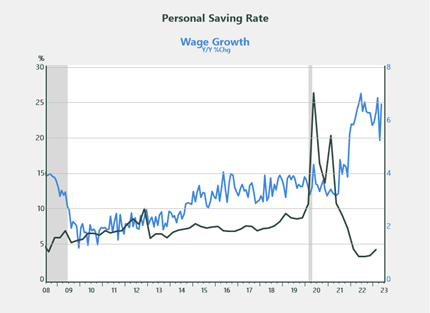
Source: BEA, Federal Reserve Bank of Atlanta, Haver Analytics
The surge in spending bodes well for an economy that is approximately two-thirds consumption. Unless there’s a significant uptick in the savings rate in the coming months coupled with a decline in consumer confidence, it’s reasonable to assume that the economy will stay on track as it did in the first half of 2023.
Trending Toward Half Full
Heading into the year, many believed the economy was half empty, with the likelihood of recession right around the corner. With the benefit of hindsight, however, we know that it was half full, following a 3.9 percent increase in GDP in the first quarter and strong equity gains year-to-date. There’s reason to believe that the trend will continue.
The job creation rate in the past six months is greater than any six-month period in the decade before the pandemic. Wages are following suit. Americans are working more, earning more, and spending their hard-earned dollars, which is a win-win from an economic perspective. With a significant breakdown in confidence between now and the end of the year being an unlikely scenario, the positive momentum should continue.
To access our full 2023 Midyear Outlook, click the Get It Now button in the sidebar to your right.


