

 Print
Print 1969 is often remembered as one of the biggest years in pop culture history. Broadway Joe Namath guaranteed his upstart AFL Jets would win the Super Bowl—and then went out and did just that. The Beatles played together in public for the last time on a London rooftop. Neil Armstrong took one small step for man and one giant leap for mankind. About 400,000 people descended on a farm in New York for the Woodstock Music Festival. And finally, the Miracle Mets won the World Series.
At this point, you’re likely wondering what any of this has to do with today’s equity markets. The answer is that, before last year, 1969 was also the last time stock and bond markets declined in the same year. In fact, 2022 was just the third time in history that this happened. Even if you look at quarterly data, stock and bond markets decline together only 10 percent of the time. So, while not unprecedented, last year's performance was certainly unusual. But this leads to a bigger question: after a rally in the first half, what can investors expect from equities in the second half of the year?
Markets Scale Wall of Worries
Last year, a lot of bad news was discounted in equity markets. The S&P had declined as much as 27 percent by early October 2022 and notched an 18.11 percent decline for the year. That same uncertainty that led to the declines still existed as we entered the new year.
Unlike 2022, in the first half of 2023, equity markets managed to scale a wall of worries. These included elevated inflationary data and Fed rate increases, the debt ceiling debate in D.C., and the second-, third-, and fourth-largest bank failures ever seen in the U.S. Despite this fraught backdrop, markets were up.
Large-Cap Growth Top Performer
In fact, the S&P 500 has rallied more than 15 percent this year. Large-cap growth has performed best, up more than 27 percent. Much of this move has been powered by the well-known mega-cap names that led the previous bull market: Facebook (Meta), Apple, Microsoft, Amazon, and Google (Alphabet). In an uncertain environment, investors sought out companies with good business models and secular growth.
Investors also became enamored with the potential for artificial intelligence. So far, the biggest beneficiary of this technology has been Nvidia, which is seeing strong demand for its graphic processing units. As a result, it is the best-performing S&P 500 stock year-to-date, up almost 200 percent. But corporations seem to think artificial intelligence could affect businesses across a wide array of industries, and investors are still trying to understand those benefits.
Small-Cap Value Suffers
Still, a rising tide has not lifted all boats to the same height. Small-caps have fared the worst. The space saw losses of more than 20 percent in 2022 and so far this year has only managed to gain 2.2 percent (see chart). This lags large-cap growth by more than 2,500 basis points (or 25 percent)!
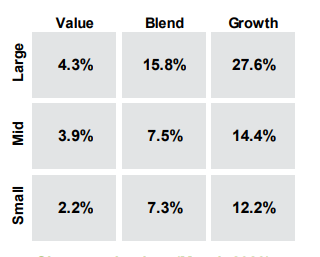
Source: FactSet, Refinitiv Datastream, Russell Investment Group, Standard & Poor's, J.P. Morgan Asset Management, as of June 20, 2023. All calculations are cumulative total return, including dividends reinvested for the stated period. Total return is based on Russell style indices except for the large-blend category, which is based on the S&P 500 Index.
On some level, this performance shouldn’t be surprising. Financials account for 22 percent of the Russell 2000 Value Index, and the failures of Silicon Valley Bank, Signature Bank, and First Republic weighed heavily on performance earlier in the year.
Markets Watching Monetary Policy and Earnings
Investors have been looking for the positives in the first-half news flow and have reacted accordingly. The drivers of the market rally have been twofold. First is the belief that the Fed is now closing in on the end of its rate hike cycle. The recent pause at the June meeting adds further weight to this view. This has alleviated the pressure we saw last year on valuations, particularly for longer-duration growth assets.
Second, first-quarter earnings were better than expected. Corporations did a good job setting earnings expectations at reasonable (if not conservative) levels entering the year. First-quarter earnings expectations for the S&P 500 initially called for a 6 percent decline but came in closer to a 2 percent decline. This has pushed earnings growth estimates to the 0 percent to 1 percent range for 2023 and to 5 percent for 2024. The avoidance of an earnings recession has improved investor sentiment so far this year.
Entering 2023, stocks were relatively attractive—especially after a difficult year in the equity markets. The S&P 500 was trading just below its 25-year average forward P/E ratio of 16.8x. (The forward price-to-earnings [P/E] ratio divides the current share price of the index by its estimated future earnings.) Equity valuations have since risen on the heels of the market rally and a muted earnings growth outlook.
Opportunities Across Asset Classes
Looking at the S&P 500 from a broad market-cap-weighted basis doesn’t tell the full story. Mid- and small-cap areas of the market, for example, are below their historical valuation averages. This shows that there may be opportunities to add value to portfolios in the longer term in areas of the market that haven’t rallied strongly this year (see chart below).
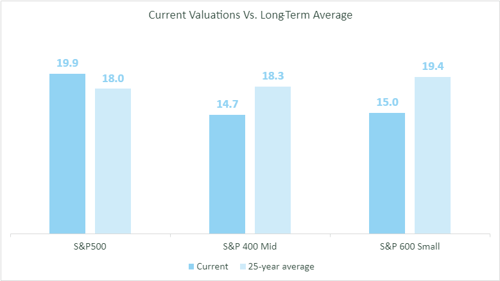
Source: Commonwealth and Bloomberg (as of June 20, 2023). Data represents forward P/E.
It's important to note that cheap investments alone do not necessarily make for good long-term performance. Fundamentals also play a role in determining the future direction of asset classes. In fact, the best investments tend to have a combination of relatively attractive valuations and improving fundamentals.
Caution Ahead?
Besides inflation and monetary policy, markets will be watching whether banking issues will continue and the impact that could have on lending and economic growth. While geopolitical risks are not quite as front-and-center today as they were at the start of the year, the environment remains uncertain, and any bad news could weigh on stocks.
As a result, the road ahead for equity markets calls for some caution. Given the diversion in potential outcomes, a portfolio balanced across the risk spectrum remains the best path forward for most investors. It’s important to remain focused on the underlying data—not the headlines—and react accordingly to take advantage of potential opportunities that may arise from any increased volatility.
To access our full 2023 Midyear Outlook, click the Get It Now button in the sidebar to your right.


