Markets return to gains . . .
After a turbulent June, July marked a return to positive territory for U.S. equity markets. The S&P 500 Index was up 5.09 percent, the Dow Jones Industrial Average gained 4.12 percent, and the Nasdaq Composite climbed 6.56 percent.
The big news during the month was corporate earnings. As of July’s end, 73 percent of companies had beaten earnings estimates, but earnings growth had clearly slowed. Though positive—1.8 percent so far—it has been dependent on the financial sector’s very strong results. Excluding financials, earnings have declined 2.9 percent.
International developed markets also did well in July. The MSCI EAFE Index rose 5.28 percent. Though Europe remains weak, there is a sense that the situation has been improving, with better manufacturing and consumer confidence reports from major countries. Developing markets did not fare as well last month, as reflected in the MSCI Emerging Markets Index, which gained 0.77 percent.
U.S. interest rates moved very little in July, following a substantial increase in June. Risky bonds engaged in a relief rally, after suffering second-quarter losses. Global bonds outperformed U.S. bonds and were the best-performing fixed income asset class. Although they struggled in the second quarter, high-yield bonds, as tracked by the Barclays Capital U.S. Corporate High Yield Index, returned 1.9 percent in July. Yields have risen significantly, and demand for the asset class returned, as Treasury rates stabilized. Bank loans also performed well over the same period.
Commodity prices turned around in July, with the Dow Jones-UBS Commodity Index rising 1.36 percent. Year-to-date, commodity prices are off 9.25 percent, as investor bearishness on the Chinese economy has held back prices of raw materials.
. . . as the real economy continues to recover
Economic statistics were mixed during July. Although manufacturing showed strong improvement, retail sales were disappointing. Consumer confidence bounced around but stayed at about its highest level in the past five years, even as mortgage applications dropped. Jobless claims ticked up and down. U.S. gross domestic product (GDP) grew 1.7 percent last quarter, well above the 1-percent consensus, but first-quarter growth was revised down from 1.8 percent to 1.1 percent.
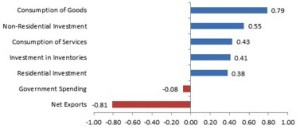
Consumer spending in the second quarter grew 1.8 percent, less than its first-quarter 2.3-percent gain, but more than had been expected, according to the U.S. Bureau of Economic Analysis. Business investment was up 4.6 percent, reversing a first-quarter decline, also according to the bureau. In addition, federal government spending fell less than expected, by 1.5 percent, while state and local spending ticked up 0.3 percent. The chart below demonstrates how each component contributed to GDP growth.
Consumption and investments were primary drivers of GDP growth in the second quarter of 2013.
Source: U.S. Bureau of Economic Analysis
Europe is looking better, but China looks weak
Although most of the European economies remain in recession, the mood appears to be shifting. Consumer confidence for the eurozone increased to its highest levels since April 2012, and unemployment also improved modestly.
China, on the other hand, has shown signs of slowing growth. After declining sharply in June, the Shanghai Stock Exchange Composite Index stabilized in July, but a weak manufacturing sector report caused the month to end on a sour note. The Chinese government’s decision to implement “Likonomics”—named after Li Keqiang, its premier—hasn’t been popular. These policies shun fiscal and monetary stimulus in favor of market reforms and deleveraging. The combination of this policy shift and emerging local government finance problems, as highlighted in a recent International Monetary Fund report, suggests that troubles in China’s equity markets may not be over.
Overall, an encouraging month
Evidence of increased economic growth supported the strong performance in U.S. equity markets. Home values have been appreciating, and employment has continued to grow. Financial markets have been rallying, and interest rates, although higher, haven’t spiked to unreasonable levels.
Risks remain, but the U.S. appears to be on the right track. The appropriate stance is cautious optimism, with a focus on the long term, as we wait to see whether the economy can transform its slow but steady growth into something more robust.
The S&P 500 Index is a broad-based measurement of changes in stock market conditions based on the average performance of 500 widely held common stocks. The Dow Jones Industrial Average is a price-weighted average of 30 actively traded blue-chip stocks. The Nasdaq Composite Index measures the performance of all issues listed in the Nasdaq Stock Market, except for rights, warrants, units, and convertible debentures. The MSCI EAFE Index is a float-adjusted market capitalization index designed to measure developed market equity performance, excluding the U.S. and Canada. The MSCI Emerging Markets Index is a market capitalization-weighted index composed of companies representative of the market structure of 26 emerging market countries in Europe, Latin America, and the Pacific Basin. It excludes closed markets and those shares in otherwise free markets that are not purchasable by foreigners. The Barclays Capital U.S. Corporate High Yield Index covers the USD-denominated, non-investment-grade, fixed-rate, taxable corporate bond market. Securities are classified as high-yield if the middle rating of Moody’s, Fitch, and S&P is Ba1/BB+/BB+ or below. The Dow Jones-UBS Commodity Index is composed of commodities traded on U.S. exchanges, with the exception of aluminum, nickel, and zinc, which trade on the London Metal Exchange (LME). The index is calculated on an excess return basis. The Shanghai Stock Exchange Composite Index is a capitalization-weighted index. The index tracks the daily price performance of all A shares and B shares listed on the Shanghai Stock Exchange. The index was developed on December 19, 1990, with a base value of 100. Index trade volume on Q is scaled down by a factor of 1,000.


 Print
Print


