

 Print
Print Lately, I've been reading that the housing market, having largely recovered from the financial crisis, is now set to stay dormant. Much of this argument seems to be based on the last couple of months, when housing has indeed been hibernating.
But I suspect we haven’t seen the end of the housing boom.
It's a question of supply and demand
Supply of housing is quite low, relative to demand, and demand is rising. We’ll get to demand in a minute, but first let’s look at the following chart, which shows the months’ supply of new houses—how many months it would take to sell the existing inventory—and compares it with prices.
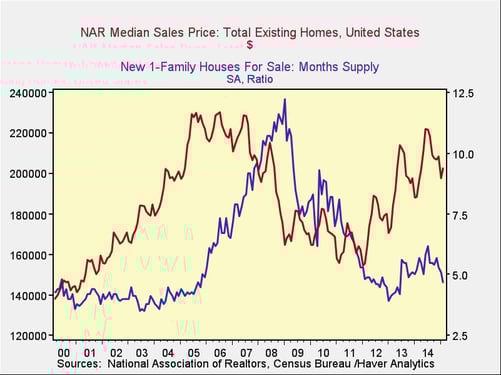
Unsurprisingly, low supply (less than about five months of inventory) leads to rising prices, with a lag, and the converse holds true. As you can see, inventory remains low, below the critical level, even as prices continue to rise, suggesting the same forces that have driven prices up so far will continue to operate.
Another way to look at it is to directly compare demand with supply and see how that stacks up to price changes, as shown in the following chart.
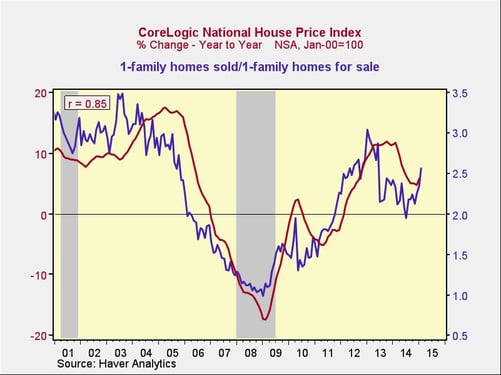
If you divide the houses sold, or effective demand, by the houses for sale, or effective supply, you get a measure of how much effective excess demand there is, which should lead to price appreciation, and that is exactly what we see.
Right now, the supply-demand balance is indicating continued, and rising, housing price increases.
Decreased supply or more buyers?
What this chart doesn’t tell us, however, is whether that ratio is being driven by a decrease in the supply of houses, which could be bad, or an increase in the number of buyers, which would be good. For that, we need to look at how demand for housing is actually generated: a combination of household formation—new households need housing—and job growth in the main age group that forms new households.
Job growth looks strong: The red line here is total employment in the prime household formation years, ages 25–34, and the blue line is the growth rate. You can see the total number of jobs is now at an all-time high, above the level in 2000 and 2008, and the growth rate is at the highest point since, and is closing in on, 2000 levels.
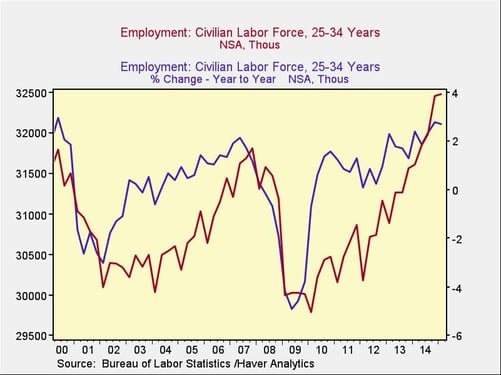
Clearly, both jobs and growth are healthy in the segment that drives entry-level housing demand.
Household formation increases: Even if young people can afford housing, though, that certainly doesn’t mean they are actually moving out on their own. One way to test that is to look at actual household formation, represented by the red line in the chart below. You can see that, in the past several years, household numbers have moved up significantly, after a pause from 2005 through 2010.
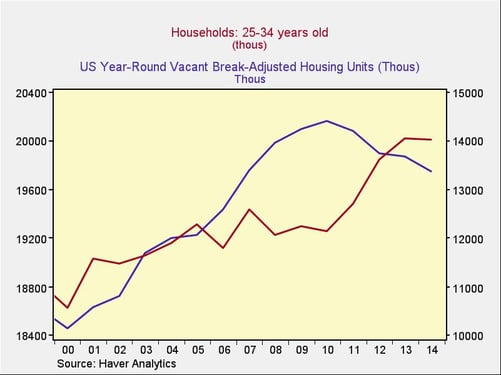
At the same time, with the blue line, we can see that the number of vacant units available has actually declined. Rising demand and declining supply, just as we saw in the second chart, have driven rising prices—and the gap between households and supply, on a macro level, is getting wider.
While you could argue that housing has had a great run—and it has—the underlying demographic and employment facts suggest continued appreciation. The only thing that might constrain it is if housing gets too expensive. Here, too, the news is good, per the following chart.
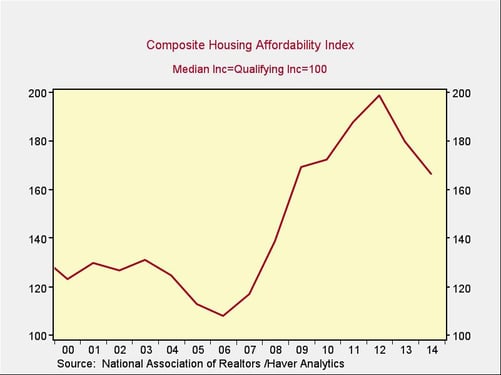
The bottom line
While housing is somewhat less affordable than it has been in the past couple of years, it remains significantly more affordable than it was in the 2000s. The combination of affordability, rising employment, and rising household formation suggests that we probably have another couple of years of housing price appreciation to go.


