

 Print
Print As the industry that led us to disaster in 2008, housing has had a long road back. You can make a good argument that, until the housing market returns to normal, the economy hasn’t really recovered. While not a defining indicator, a healthy housing market is a necessary condition for recovery.
I last looked at housing in June, so it’s time for an update. The news is actually quite good, despite some of the headlines recently.
A healthy moderation in price growth
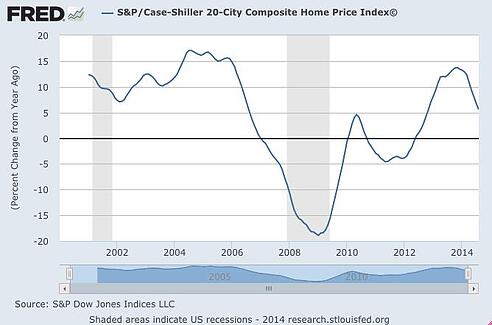
Looking at the chart below, which shows annual changes in price growth, you can see where the negative headlines come from. Annual growth in prices has dropped considerably from the 10+-percent level of the past couple of years and now hovers around 5 percent.
A slowdown, right?
Well, yes, but a predictable one. Back in June, I noted that price growth could be expected to slow to about 5 percent per year (per the chart below), which is exactly what we’re seeing.

The question is whether that moderation is a bad thing or a good thing. I’d say it’s the latter. There’s a word for when something appreciates at a double-digit rate for years on end: bubble. Look at the sustained appreciation in housing through the 2000s in the first chart, and think about where that took us. Price growth had to slow down, and the fact that it did is healthy.
Supply increases, demand rises
The next question is, What caused the moderation? Is it lack of demand (bad) or increasing supply (good)? The numbers seem to suggest it’s increasing supply. In October, single-family housing starts were up 4.2 percent—the best showing since November of last year—while permits hit their highest level since late 2008.
At the same time, homebuilding companies are reporting much higher sales revenues, with Lennar’s revenue up 25 percent and D.R. Horton’s up by 33 percent. Demand is actually rising, not falling.
This is important not only for the housing sector but for the economy as a whole, as much of the growth in homebuilding has been in multi-family housing. The recovery of single-family homebuilders says that the broader housing market is hitting its stride as well.
So, have we dug ourselves out of the hole?
By and large, we have.
- Mortgage delinquency rates have dropped below 6 percent for the first time since late 2007. We’re not yet back to the levels of the mid-2000s, but we’re moving in the right direction.
- Foreclosures have fallen to the lowest levels since the middle of 2008, showing substantial improvement, but they’re still higher than normal. While we're clearly not out of the hole yet, we’re filling it in.
Overall, the housing market looks strong going forward—normal, in fact—and the post-crisis healing is well advanced. As with many other areas of the economy (employment, business spending, interest rates), you could reasonably say that we’re within about 12 months of being back to normal.
Unlike a boom, normal is sustainable over time. Normal is what we’ve been aspiring to over the last five years, and it seems we're finally getting there.


