

 Print
Print Rereading some of my recent posts, it occurred to me that I’ve talked quite a bit about “confidence” (and the improvements thereof) without actually defining what I mean by it. Much of social science, and economics, is based on hand-waving, so when you have actual data, it makes sense to employ it.
In that spirit, here’s what I mean by “confidence” and “improvement.”
Data shows consumers are feeling good
To get the full picture of consumer confidence, we need to view the data in a couple of different ways. Let’s start with the absolute level of confidence. I will use the Conference Board’s data, as the most recent University of Michigan survey is not yet available.
Looking at the longer term, over 30 years, we can see that consumer confidence is now above the level of the mid-2000s and approaching that of the late-1980s boom. It is also at the level of the mid-1990s but has further to go to reach that of the dot-com boom in the late '90s.
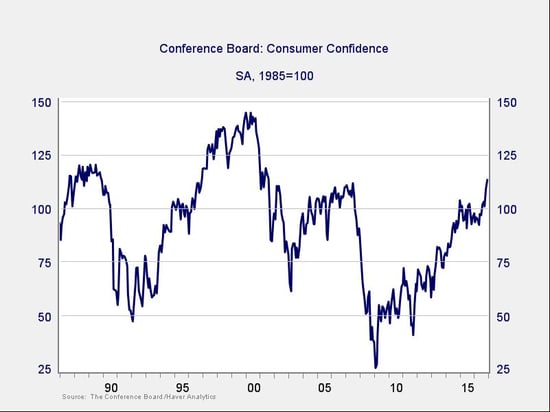
Basically, consumers feel better now than at just about any time since the peak of the dot-com boom, supporting a high level of confidence.
Moving on to “improvement,” the chart below shows that, over the past two months, we have seen more gains than at just about any time in the past three years, despite the high level of the index. Note also the downward trend from 2013 through late 2015 and the switch to an uptrend since then.
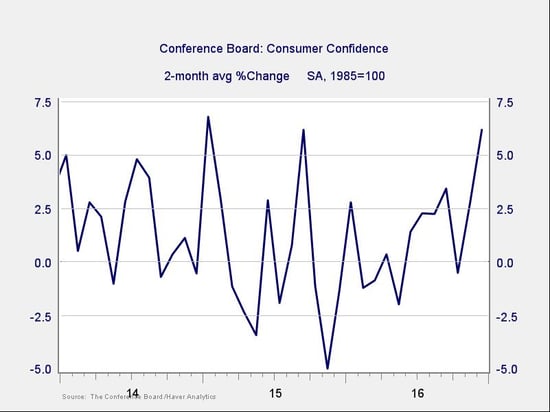
The data clearly shows that consumer confidence is both high and improving.
Ditto for businesses
Business confidence is a bit more complicated. There are two components here: manufacturing, which is affected by multiple factors outside the U.S., and non-manufacturing, which offers a better picture of U.S. economic activity. The indices are also different, in that they are constrained within a fairly narrow range simply because of the way they are constructed. Nonetheless, we can use them to get a reasonable indicator of where business confidence sits on a relative basis.
The chart below shows the composite index, which incorporates both the manufacturing and non-manufacturing components. We can see that the level of business confidence is consistent with the late 1990s and close to that of the mid-2000s. As with consumers, businesses are about as confident as they have been in previous eras that, in retrospect, were booms.
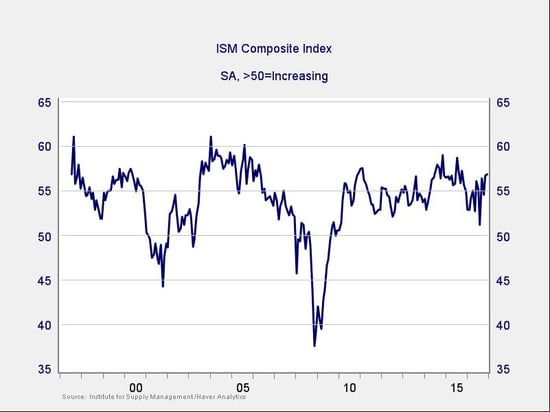
We also see the same kind of improvement over the past couple of months that we saw in the consumer data. The percentage increase has been substantial, as these things go.
Another, more sensitive, way to assess business confidence is to use the National Federation of Independent Business survey. Because this survey focuses on smaller companies, which are in many ways more volatile, changes tend to show up more clearly.
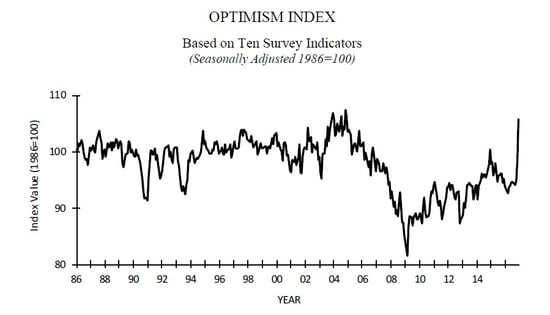
Here again, “confidence” means that firms are as confident as they have been in previous boom times—in this case, the mid-2000s—and more confident than they were in the booms of the late 1980s and 1990s. “Improvement” speaks for itself, with the spike in December.
A great deal of underlying data for each of these headline series also supports both confidence and improvement.
What next?
With confidence at boom levels across the board, one of two things is likely to happen:
- The economy could continue to improve, moving further into boom-like conditions. That's what the market—along with consumers and businesses—is expecting. After all, that is why they are confident, which can become a self-fulfilling prophecy. I suspect that, for reasons I put forth yesterday, this is the more likely course, in which case we will have a strong 2017.
- We could be disappointed. That’s happened on several occasions over the past three years, as shown in the charts above. And that is why it’s so important to keep monitoring the economy, as we do here on a monthly basis. I’ll be posting my economic and market risk updates later this week, which will show us how the facts on the ground compare with the very real improvement in confidence.


