Print
PrintThe economic news this month remains good, largely validating last month’s positive moves and increasing the chance that recent downward trends are changing. Although two months of data aren’t quite enough to declare victory—particularly since some gains were given back—the continuation of the positive trends is very encouraging.
The Service Sector
Signal: Green light
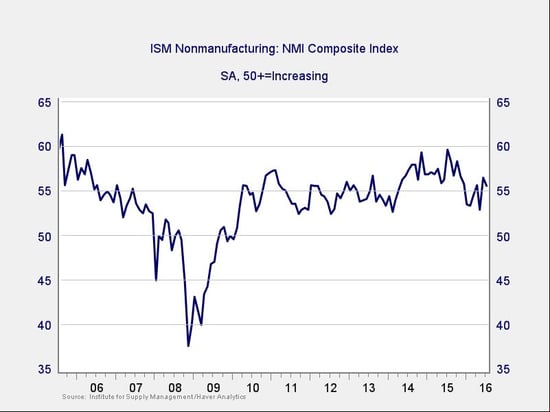
After dropping close to its lowest levels since the financial crisis, service sector sentiment staged a sharp rally in June and remained near that point this past month. After two months of encouraging results—and with the survey back to growth levels above those during most of the recovery and even before the crisis—the service sector appears to be doing well. Continued business and employment expansion now looks increasingly likely.
Ongoing strength in the service sector is consistent with business confidence; as a representative sample of the largest sector of business, this is an important leading indicator.
Private Employment: Annual Change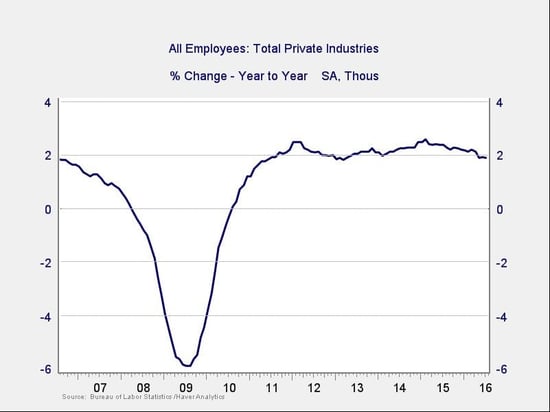
Signal: Green light
The past month’s job creation continued the previous month’s strong showing, suggesting that the very weak result of two months ago was an aberration. The annual trend, which of course includes that weak month, is in line with this month’s data and at levels consistent with stable growth, like that of the mid-2000s.
Because this is an annual figure, the changes are slower and smaller than those we see in more frequently reported data. Overall, given the volatility of employment growth, this factor remains a green light.
Private Employment: Monthly Change

Signal: Green light, but keep an eye on it
These are the same numbers as in the previous chart, but on a month-to-month basis, which can provide a better short-term signal. July’s increase substantially beat expectations and, along with the prior month’s gains, indicated that the weak May results were an outlier. The latest data also suggests that the noisy downward trend over the past several months may have been just that, noise.
Given the strong number, we’ll keep this indicator at a green light, as it confirms the positive signal from last month’s data.
Yield Curve (10-Year Minus 3-Month Treasury Rates)
Signal: Green light
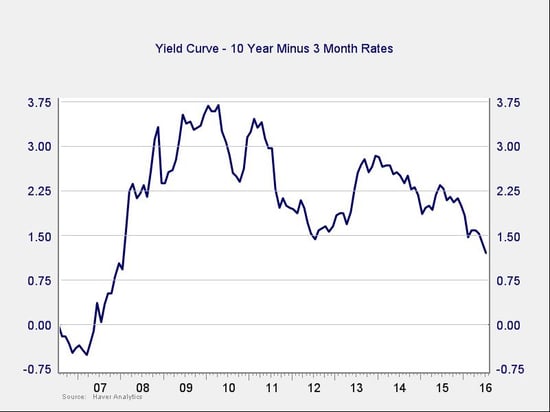
Rates for the 10-year Treasury were quite volatile in July but ended up where they started. Short-term rates, however, ticked up slightly, and the spread between long-term and short-term rates narrowed accordingly. The spread remains at healthy levels, but the trend is generally negative as the yield curve continues to flatten.
The negative risk here is much smaller than with the other indicators; unlike in past cases, the relatively low longer rates appear to be driven by demand from foreign investors rather than by U.S. economic weakness. Given that and the level of the spread, this indicator remains in healthy territory.
Consumer Confidence: Annual Change
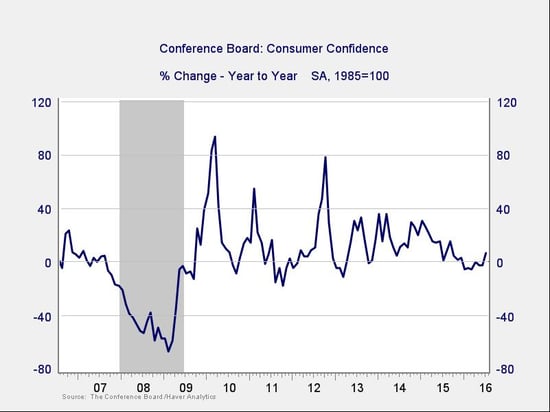
Signal: Green light
The year-on-year change in consumer confidence has increased for several months, moving back into positive territory. I’m changing the signal back to green primarily based on the multi-month improvement rather than this month’s data, as the tick above zero is largely due to a weak result last July.
All in all, however, consumer confidence remains at healthy levels, and the decline in the growth rate has apparently been arrested and even converted into a positive trend.
Conclusion: Economy healthy, negative trends continue to reverse
The continued improvements in multiple metrics suggest that the negative trends of the past couple of months are reversing. This makes sense, as we’ve seen pullbacks like this before in the recovery, and the reversal of the most recent one would simply be in line with previous experience. It’s also consistent with improvements in many other areas of the economy that we don’t track here.
We certainly need to watch how things evolve, but given the generally healthy levels of the most recent data and the increasing likelihood that trends are turning favorable, the overall signal for the economy remains a green light.