

 Print
PrintI’ve been getting more “disaster chic” questions recently, and I thought I’d get ahead of what I expect will be the next driver of such concerns. Over the weekend, Mark Hulbert wrote a column about a scary chart that’s making the rounds, showing very real similarities between the way the market behaved before the crash in 1929 and right now.
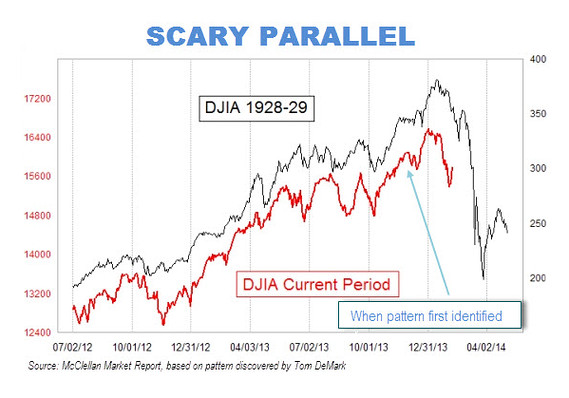
What are we to make of this? Hulbert is an excellent analyst and notes many of the potential problems with the chart. But he also correctly notes that the longer the similarity holds, the more seriously it should be taken. Let’s consider the chart at face value (which is almost always a bad idea, but we’ll do it for the sake of argument), and see what it would mean if true.
If we experience the kind of drop suggested in the next couple of months, it would take the Dow down to about 12,500, rounded, for about a 22-percent drop. That sounds bad, and it is—almost four times the recent pullback we suffered through. On a month-to-month basis, the only time we’ve witnessed this type of decline was in 1987. Even in 2008–2009, we didn’t see that kind of monthly drop. We did, of course, have multiple months of somewhat smaller drops, which could also be what we see here, if the chart is correct.
As bad as that sounds, and as bad as it would feel, let’s put this in a bit of context. A plunge down to 12,500 (a drop of 22 percent) would take us back to where stock prices were in late 2012. Less than a year and a half ago, at a time when the economy was struggling with the fiscal cliff and a slow, on-again, off-again recovery—in other words, a much worse economic environment than today. In a slightly different context, other markets—bonds and gold—have suffered similar corrections in the past year and partially recovered, without the world ending. In terms of where the market was 18 months ago, in terms of where the economy is today, and in a cross-market context, a correction like this would be neither exceptional nor something to get especially worried about.
For some additional context, the exceptional returns of 2013 were largely the result of multiple expansion rather than growth in earnings, which put values at very high levels by many metrics. There’s a tendency to assume that high values are the right number, and any correction would therefore be a reduction to a wrong number. That is not the case. Bringing values back closer to historical levels is something that should be expected over time; it shouldn’t come as a shock.
There are other reasons to think that stock prices may suffer a correction. Margin debt at broker/dealers—that is, money borrowed to buy stocks—is at all-time highs. Earnings growth is slowing, as many of the tailwinds, such as financing with low interest-rate debt and share buybacks, are slowing. Expectations for growth are moderating. And, of course, the recent pullback brought risk back to the front of investors’ minds.
In short, another pullback like the one we just had, or a considerably worse one, is certainly possible—and, given a long enough time frame, inevitable. That’s just how markets work. In fact, it has been a very long time since we’ve had such a pullback, which probably means we’re about due. I have written about many of these factors multiple times.
What it does not mean, however, is that we will enter another Great Depression. In case you missed it, we are working our way out of a financial crisis and simply haven’t built up the imbalances that would trigger another one of the same magnitude. It will happen someday, but probably not yet. The real economy is poised to continue to grow.
Finally, remember that this analysis is based on the chart being right, which it almost certainly is not. Charts usually look reliable right up until they don’t, and there is no real reason why our future should look like this section of the past. So let’s worry about the real risk to our portfolios, by planning properly and thinking through what we will do if a correction happens. But let’s not start planning (again!) for the end of the world. We had that in 2008, and we’re still here.


