

 Print
Print Brad here. Today, we’re launching a new monthly column in which members of Commonwealth’s Investment Management and Research team will share their learnings and viewpoints on various topics with you. Our first post is from Nicholas Follett, manager of fixed income. Enjoy!
Each month, Commonwealth’s Investment Management and Research team spends hundreds of hours attending conferences and meeting with portfolio managers, economists, and other specialized resources such as global security experts. The data we get from these activities informs our market outlook, guides our portfolio allocations, and influences our investments. But our notes from these conferences and meetings usually remain in a Moleskine-shaped vacuum, rarely seeing the light of day.
With this column, on the last Friday of every month, we’ll be providing an overview of what we learn during our travels and from our conversations. For instance, we might present our take on an interesting data point, a new way to think about industry assumptions, or a story from a keynote speaker. Today, I’ll discuss a fresh way to look at a familiar indicator, the 2–10 U.S. Treasury yield spread.
Analyzing the yield spread: Accuracy vs. precision
Brad has written at length about the 2–10 Treasury yield spread and how it’s a reliable indicator of a pending recession. As a quick refresher on the topic, an inverted yield curve occurs when short-term Treasury debt, such as a 2-year note, has a greater yield than 10-year Treasury debt. Since the mid-1970s, an inverted yield curve has preceded all five recessions by a time period of about 10 months to 2.5 years. As an indicator of recession, it’s been extremely accurate. As a guide to portfolio management, however, it’s imprecise and far from an investable thesis. So, at a recent Goldman Sachs conference, I was highly interested to discover a different take on the inverted yield curve. In fact, the insight became one of my favorite takeaways.
Discussing the 2–10 Treasury yield spread, Goldman Sachs analysts theorized that it wasn’t the inversion that mattered, but rather the re-steepening of the yield curve after an inversion. As evidence, they revealed that the average number of days to a recession following an inversion is 632. After the 2–10 yield spread steepens to 100 bps, however, the average number of days to a recession drops to 72. Much more precise.
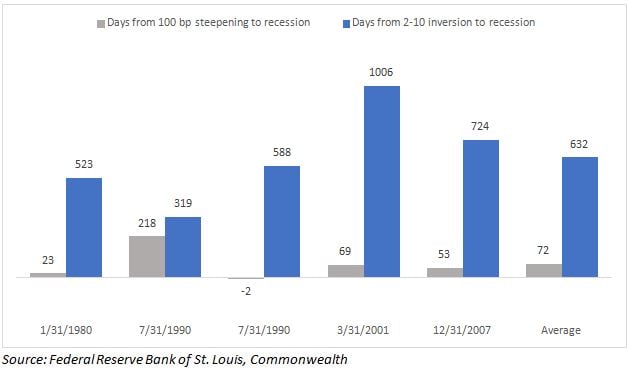
Coincidentally, when I was at the conference, Brad wrote about the re-steepening of the yield curve, but he went out only to 75 bps. Later, we reconsidered the analysis above with regard to the spread between the 3-month and 10-year Treasury rates. The result was very similar, with the time to recession from re-steepening of the yield curve cut to about 50 days.
For the current economy, there’s good news and bad news. The bad news is that the curve inverted during the summer, so the clock is ticking. The good news is that the 2–10 U.S. Treasury yield spread is at about 13 bps as I write. So, according to the new, more precise metric, we should have some time.
A dissentient opinion
Michael Hasenstab, PhD, the chief investment officer of Templeton Global Macro, has long been known as a manager of high conviction with little regard for a benchmark. He’s made a name for himself and his firm by following the beat of his own drum, be it in reestablishing a debt market in Ireland and Ukraine or finding value through bottom-up credit research in countries that many would have difficulty finding on a map. But recently, Hasenstab has been shifting to a flight-to-quality, risk-off approach to investing. This includes flipping a short Japanese yen position in favor of going long on the currency.
Historically, the yen has been a safe haven that has provided excess returns over U.S. Treasuries in times of market sell-off, in particular during the global financial crisis. For Hasenstab, that’s the point. He doesn’t know when, and doesn’t know how, but he’s preparing for a 2008-like event. The metaphor he used to describe our current economic situation is a pile of wood doused with gasoline with several people standing around it holding fireworks. It doesn’t matter whose ember sparks the fire. It only matters that there’s a fire. This is a variation of what we’ve been hearing from multiple managers: the market is perfectly priced and spreads are tight, but no one can locate a catalyst for disruption. As a result, there isn’t any appropriate risk strategy in which to deploy capital.
To be clear, Commonwealth’s Investment Management and Research team does not believe that a crisis of 2008 proportions is coming. Nor is Hasenstab’s opinion even the consensus of Franklin Templeton’s fixed income team. It is, however, an interesting take from a top money manager. As the character Tommy DeVito says in Goodfellas, “One dog goes one way, the other dog goes the other way, and this guy’s sayin’ ‘Whadda ya want from me?’”
Whom do we believe?
If the yield curve analysis from Goldman Sachs is telling us that things are fine, and Franklin Templeton is positioning for a 2008-like event, they both can’t be right. So, whom do we believe? One of the great things about attending conferences is hearing dissenting viewpoints from asset managers. The fact is, we won’t know which premise is the correct one until the outcome arrives. But that’s the point: don’t try to time the market. Stay invested, stay disciplined, and know what you own. My takeaway is that investing is a waiting game, whether that means watching for signals within portfolios or watching the market for triggers.


