

 Print
Print Since the election, much of the financial commentary has centered on the stock market's surprising surge. In fact, though, the largest changes by far have been in expectations for interest rates, which, in turn, have affected the bond markets.
Let’s take a look at what this means for the economy and our investments.
Yields climb, but for how long?
As you can see in the chart below, yields on the 10-year U.S. Treasury bond, which is used as a benchmark around the world, have spiked since the election, moving up by 40 basis points, the biggest jump in years.

At the same time, however, actual yields remain at or below where they were at the start of the year and well within the range of the past two years. Going back a bit further, we’re still below the yields that prevailed in 2014.
In other words, bond yields are still quite low, even by the standards of the past couple of years, and the bump up has been just that—a bump.
Why did yields go up? There are few possible explanations:
- People buy bonds when the world is uncertain, driving yields down. With uncertainty abating now that the election is over, a rise in yields is just a normal reaction.
- Another possibility is that investors see higher inflation ahead. That might end up playing out, but the most recent data shows core inflation ticking down.
- Higher yields might also be a response to expected faster growth, which would actually be positive overall.
- Finally, there are some signs that foreign holders of U.S. debt have been selling in the aftermath of the election, which would drive yields up. If so, that selling is likely to be a short-term factor, so yields may well stabilize or even drop back a bit when it stops.
Indeed, all of these factors are likely to be shorter term in nature, and there is no evidence yet that yields are poised to break above the levels of the past couple of years. More likely, we will see yields stabilize at levels that reflect the new environment, and there are signs that may be happening.
What can we expect from fixed income investments?
Lower yields increase the value of fixed income investments, such as bonds, while rising yields decrease values. Offsetting these changes in value, however, are the expected returns from reinvesting any cash flows from interest payments or capital repayments. The net effect, therefore, is less than might be suggested by the change in yields itself, as you can see in the chart below.
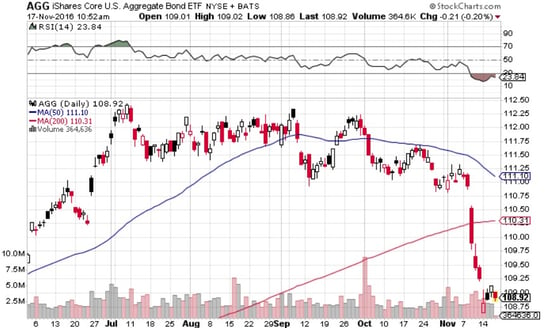
Although there was a substantial reaction after the election, the net decline was much less than the increase in yields would have suggested. You can also see that, after the initial drop, prices have stabilized at levels close to what we saw at the start of the year. Again, this is a normal reaction, with prices and yields simply reverting to their levels at the beginning of 2016.
A note on municipals. This reaction has been consistent across most sectors and geographies of the fixed income universe, but one area deserves special comment: municipal securities, which have the added benefit of tax exemptions. If tax rates decrease, as anticipated, the benefit of those exemptions would decrease. In light of that, municipal prices have taken an additional hit.
Unless the tax cuts are even greater than now expected, however, any damage is likely already done. Over the medium term, tax benefits will likely continue to be a significant support for the municipal market, and any damage may well be reversed over time. The damage appears to be limited, though, and prices remain consistent with those of the past couple of years.
Overall, a pretty normal reaction
Bond yields have moved up, but only to levels that have been typical over the last two years. Fixed income investments have responded to that increase, but in a rational way, and are still at levels we saw earlier this year. In fact, the market adjustment in response to the election is not so much a significant change as a reversion to a more normal environment, absent the risk and uncertainties the election created.
Despite some short-term declines in fixed income values, the value of the asset class as a whole remains solid, and this kind of market dislocation can even create opportunities. As usual, the best response is not to panic. This is normal.
.jpg?width=2000&height=1328&name=615x408_Hubspot%20(1).jpg "615x408_Hubspot (1)")

