
With all of the headlines about interest rates hitting record lows—and with the worries about why this has happened and what it means—it is important to put some facts and context around what, in many ways, is an unprecedented set of circumstances. The following piece by Meagan Rogers, manager of Commonwealth’s Fixed Income Research team, does just that. She does an excellent job explaining the what, why, and how of lower yields, and I think it is well worth your time. Thanks, Meagan!
Since the U.K. surprised markets with an affirmative Brexit vote in late June, investors have been puzzled over trending market movements. More specifically, domestic yields on the intermediate and long end of the curve have declined notably during this period while domestic equity markets have rallied, setting all-time intra-day highs on July 11, 2016.
Typically, declining U.S. Treasury yields are a signal from market participants that risk aversion is rising, consistent with a normal “risk-off” trade. In this scenario, higher-risk asset classes, such as high-yield and equities, often decline in value due to a myriad of potential investor concerns related to market, economic, and political uncertainty. Yet in today’s environment, we are not observing this historically divergent relationship between high-quality fixed income and equity markets. Why? What’s different today, and why should investors be aware?
“Easy” monetary policy
The shape of the domestic yield curve is influenced by a number of factors. The short end of the domestic curve is most directly affected by monetary policy set by the Federal Reserve through its stated target rate, which is announced regularly at Fed meetings. It has been scrutinized by market participants over the last several years as the Fed has attempted to begin increasing this target (albeit without much success).
The Fed had worked to influence the intermediate and long portion of the domestic curve through its various unprecedented quantitative easing programs since the 2008‒2009 credit crisis as well; however, traditional monetary policy has very little direct impact on the long end of the curve. The long end of the curve is most directly influenced by Treasury market demand and supply dynamics, as well as by long-term inflation expectations.
And today, surging demand for Treasury securities among global investors appears to be the paramount driver of lower yields across the intermediate to long end of the domestic curve. What is driving this uptick in demand?
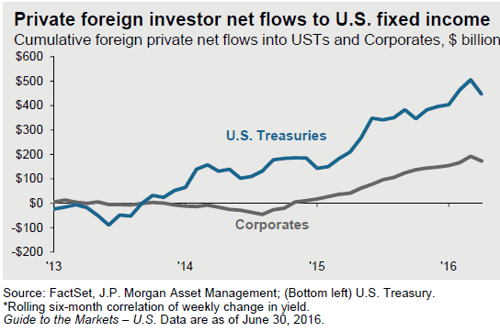
Well, with extraordinary “easy” monetary policy employed among developed economies in recent years, investors in those locales (e.g., Japan, Germany, and Switzerland) are being forced to broaden their scope of investable assets to generate positive nominal returns. As a result, foreign private net flows into U.S. fixed income have increased notably in recent years, as illustrated in the chart below.
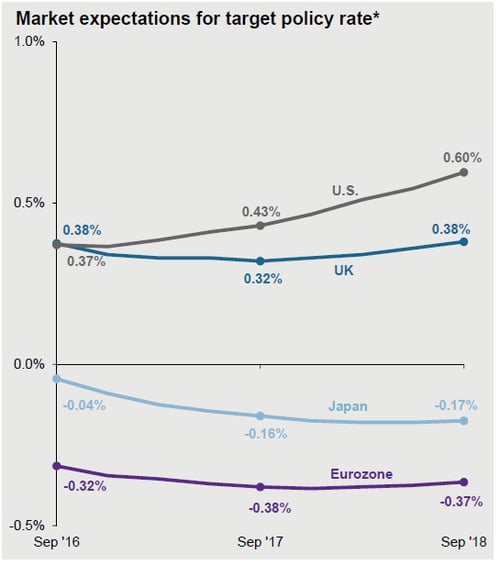
And it doesn’t appear that this situation is likely to change soon. After years of debate, the consensus opinion among investors and economists is now handily biased for increasingly easy monetary policy to continue among developed world central bankers in the near term, as indicated by the next chart. This is largely due to expectations for modestly deteriorating economic growth in key economies.

Negative yields in global bond markets
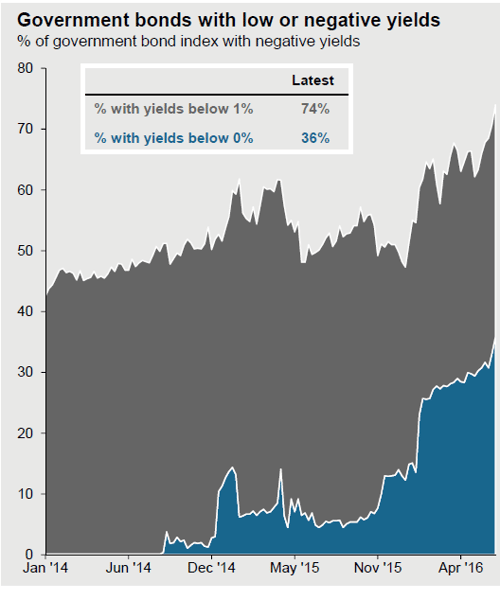
Consequently, we have observed a growing portion of the global bond market with low (less than 1 percent) or negative yields. This trend first became topical following the move by both the Bank of Japan and the European Central Bank to lower deposit rates into negative territory in the spring of 2016. Since that time, the trend has grown considerably.

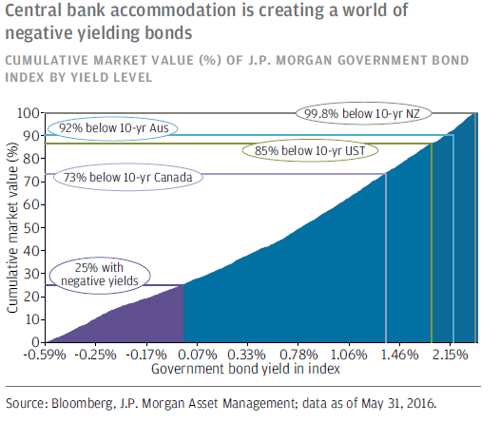
Although U.S. Treasuries continue to pursue historic lows, today’s yields continue to represent attractive relative-value opportunities for foreign investors as the majority of the global bond market now yields less than the 10-year U.S. Treasury. So while absolute valuations in U.S. fixed income markets may look largely unattractive by historical standards (especially to U.S. investors), global investors continue to frame the existing opportunity set in a relative-value framework.
What does this mean for investors?
In an environment where increasing demand for domestic fixed income securities continues to displace historical relationships among asset classes and risk sentiments, it will become increasingly challenging for central banks to manage single-country monetary policies. This idea is compounded by the interconnectedness of global economies and markets today.
For investors, it is essential to note that the historically asymmetrical returns of fixed income markets have become increasingly so. This means that investors will be compensated less for taking additional risk, whether that be credit or duration risk. Also, this environment will require more diligence and mindfulness from investors looking to put capital to work in fixed income markets, as traditional market indicators appear to be less reliable than in years past.


 Print
Print

