

 Print
Print Let’s take the factors we discussed yesterday and apply them to the countries that matter, starting with China.
The largest economy outside the U.S., China is approaching several challenges, the most urgent of which is the need to shift economic growth away from infrastructure and investment and toward consumption. Let’s examine the data and see what an outside view suggests for investors.
Economic openness: a weakening export advantage
It’s interesting—and a bit surprising—to see that China’s exports are largely manufactured goods, with a weighting toward more complex products. This mix is reasonably similar to that of the European countries and starting to approach the export mix of Japan and even the U.S.
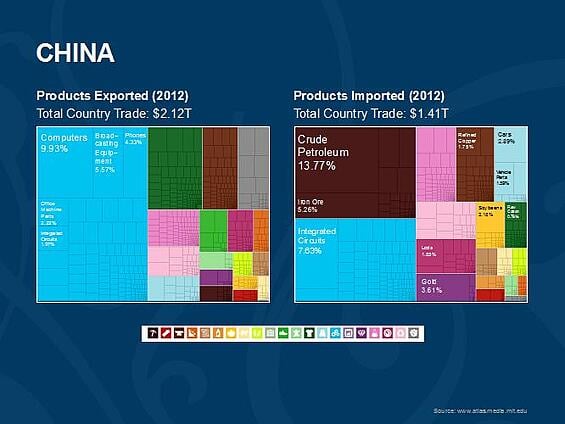
This means that China, which historically has not competed directly with the developed world, is getting very close to doing just that. In the past, China has been able to make products, and take markets, based on lower labor costs and product complexity. As its export mix gets closer to that of the developed world, its advantage erodes.
This is particularly important because China has one of the highest dependencies on trade in the world. A slowdown in export growth would hit economic growth much harder than in a less exposed economy, such as Brazil. What’s more, its net exports are actually slightly negative. China needs to continue to increase its exports, not just for growth but simply to break even on its imports.
Resource exposure: oil prices a tailwind
Offsetting this pending headwind, of course, is the benefit from lower oil prices, as well as other raw material prices. This benefit could conceivably make up for all or most of the drag imposed by an increasingly competitive trade environment.
The problem, though, is that the headwind is likely to get stronger over the next five years, as China continues its attempt to move up the value chain with its exports. Meanwhile, commodity prices may well recover from current low levels and diminish the tailwind.
Fiscal balance: in good shape, but some risks
Another positive factor, at least at face value, is China’s very low debt-to-GDP ratio. If it needs to, China appears to be in a position to keep supporting its economy through government spending.
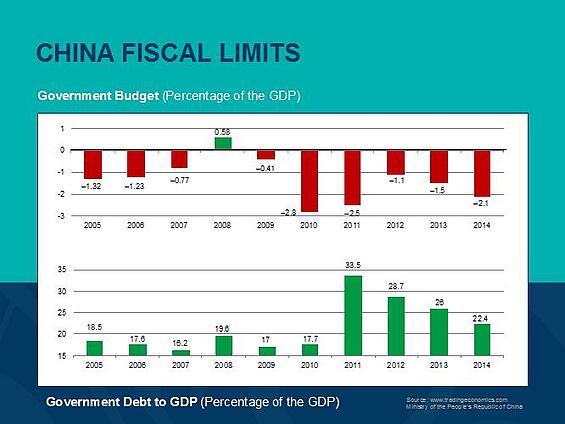
Even though it has run a deficit over the past six years, the fact that the economy grew faster than the debt meant the debt-to-GDP ratio continued to decline. Based on governmental statistics, China is in very good shape in this area.
A risk factor here is that many nominally separate or private entities—local governments or banks, for example—although not included in the above statistics, will effectively be supported by the state, and their debts could reasonably be rolled into the numbers above. These numbers, therefore, do have downside risk built in, which may be significant, limiting the positive effect of this factor.
Another concern about China’s next five years relates to the government’s support of the economy. I’ve already mentioned the need to dial back on investment as a component of growth, which hasn’t really happened over the past several years. The right-hand portion of the chart below shows the decreasing effect of credit-driven stimulus.
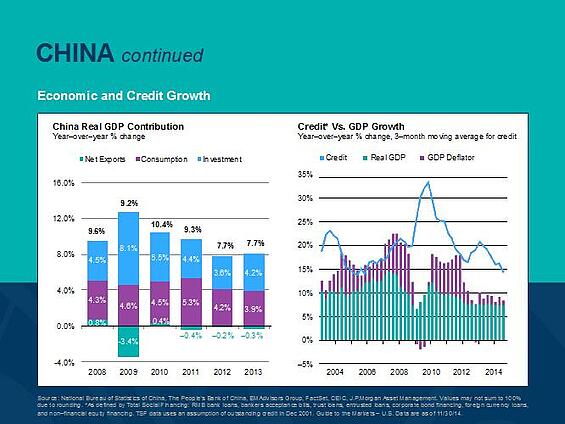
Note that, in 2004, credit spiked, followed by faster growth shortly thereafter. Same thing in 2009. In 2013, however, credit rose and economic growth actually declined. This suggests that, although China probably has the fiscal ability to stimulate the economy, it may be much less effective than it has been.
Conclusion: proceed with caution
Looking at all of these factors, we have one big positive—the lower price of oil—offset by multiple negatives, including an increasingly competitive trade environment, decreasing stimulus effectiveness, and a need to restructure economic demand. The positive factor, oil, is probably close to its peak now, while the negative factors are likely to grow over the next five years.
On balance, this outside view suggests that Chinese growth is very likely to slow from current levels in a way that will be difficult to combat. For investors, caution seems the best course, despite the current run-up in Chinese markets.


