 Now that we’ve determined which countries are globally relevant, from an economic point of view, we need to decide which factors really matter in how those countries will fare over the next five years.
Let’s take the outside view
The problem here is an embarrassing surplus of data—there are literally thousands of data points we could use to evaluate a country's economic future. In a situation like this, I try to take the outside view, a term developed by Daniel Kahneman in Thinking, Fast and Slow, a book I reviewed here.
To oversimplify, rather than analyzing the specifics, the outside view looks at the average results of all the data in order to determine a likely outcome. It’s top-down rather than bottom-up. For instance, instead of trying to determine whether China’s growth rate will be 7 percent or 6.5 percent, say, we try to identify macro factors that would make China’s growth higher or lower.
Taking the outside view, factors that matter have to be macro in nature, available and similar across all countries, and easily relatable to economic performance, both in the country itself and on a systemic level.
For this series, I settled on three factors that meet those criteria:
- Economic openness, by which I mean dependence on trade
- Resource exposure, which can be both positive and negative
- Country-level fiscal balance
Economic openness
The goal here is to assess a country’s ability to profit from (as well as its risk from) exports.
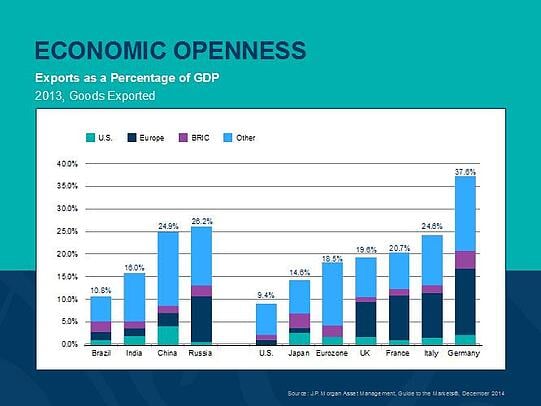
The countries shown in the chart above can be divided into roughly three categories:
- The first group, with low export exposure, consists of the U.S. and Brazil.
- The second group—Japan, India, and the eurozone as a whole—has medium export exposure. (We’ll talk more about Europe in a second.)
- The third group, consisting of China, Russia, and several European countries, has very high export exposure.
Europe is interesting in that it has only moderate export exposure as a whole, but the largest and most economically important countries—Germany, France, and Italy—actually have high exposure. Effectively, then, Europe falls into the high-exposure group.
Resource exposure
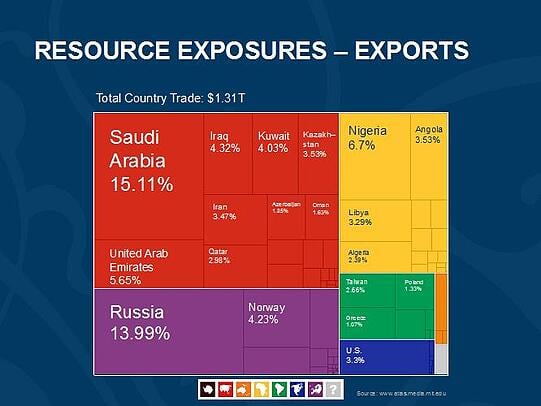
The best example right now of resource exposure is oil prices. With prices down by half or more, countries that import oil will benefit, and those that export oil will suffer.
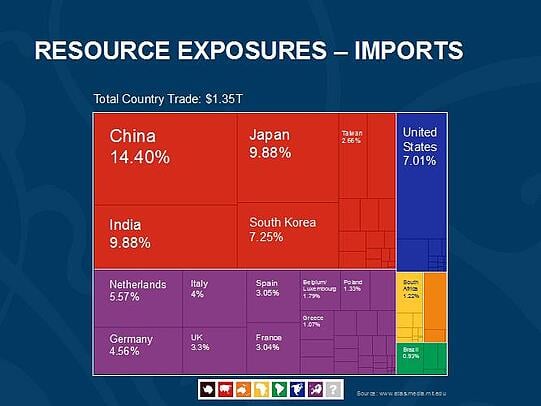
The chart above shows who will benefit most from lower oil prices, with Asia in the lead, followed by Europe. This, to me, is a classic example of the outside view; we’re simply looking at the big picture, and the emergent consequences are obvious. It's supported by the chart below, which shows imports of natural gas.
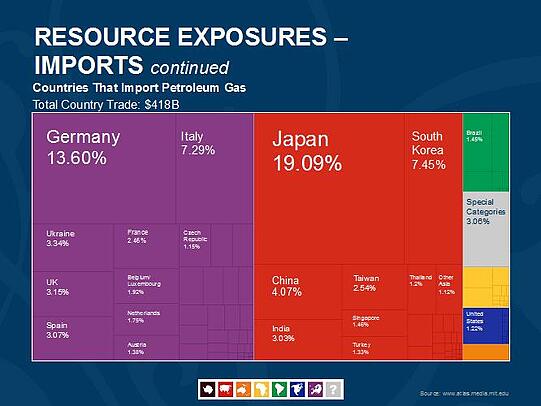
Again, we can see that Europe and Asia will be the principal beneficiaries of reduced gas prices. Clearly, the recent decline in energy prices will have a huge positive effect across both continents.
On the flip side, the countries that export oil, shown in the following chart, will suffer.
Fiscal balance
The final factor, fiscal balance, relates to growth rates, the ability of a government to support its economy over time, and also to interest rates—all of which affect economic performance and stability.
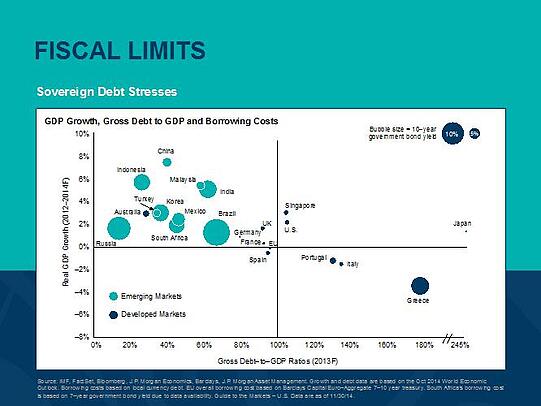
Looking at the chart, you can see a clear relationship between debt and growth, but not between interest rates and debt. Over the next five years, then, this is a good factor for assessing likely growth, but not so much for interest rates.
In the next couple of days, we’ll delve deeper into what these factors mean for the countries that matter.


 Print
Print


