

 Print
Print Whenever the market drops, I get calls asking me to explain why. There’s no short answer, of course, but today is an interesting time to look at short-term market behavior and try to understand what makes it tick.
Market behavior over the past six months
Looking at this chart of the S&P 500, we see that the index has been bouncing around between 2,000 and 2,120 since about November of last year. It goes up, then down, then up again.
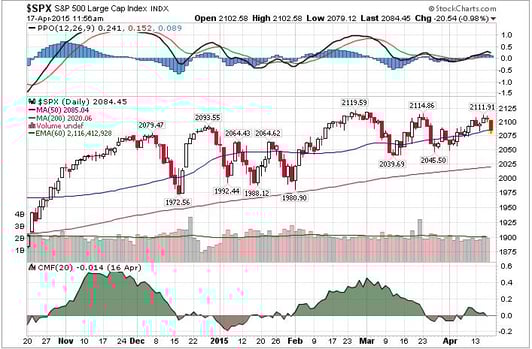
Recently, there’s been much more up than down, which suggests today’s down is just an adjustment and nothing to worry about. As regular readers know, I start to pay attention when we get close to the 200-day moving average, and we’re nowhere near that point.
Why the narrow range?
If we’re not worried about today, though, we have to wonder why the S&P 500 has been trading in a narrow range, and when and if that might change.
Stock values ultimately come down to two factors:
- How much companies earn
- What investors are willing to pay for that stream of earnings
Both factors have been in flux in recent months, leading to the volatility we’ve seen and the inability of stock prices to break out of that range.
First, let’s look at earnings. We have seen earnings expectations in the first half of 2015 move decisively lower, which could drive stock prices down. Companies often beat those lowered expectations, however, which can bring prices back up. Recent history supports this: we’ve seen the market react to individual companies’ good and bad earnings performances over the past couple of weeks by bouncing up and down, but no convincing trend has emerged, bringing us to the volatile, range-bound market we have seen.
Something similar is happening with market valuations. Valuations depend heavily on interest rates, and the willingness of the Federal Reserve to raise rates (and when) directly affects how much investors will pay. Lower rates mean higher prices for stocks, and low rates depend largely on what the Fed does.
Just as with earnings, we have mixed news:
- Lowered growth expectations for the first quarter should keep rates low and prices high.
- A weak employment report might keep rates low.
- A strong retail sales report could prompt the Fed to raise rates sooner.
- Today’s high inflation report might also make the Fed raise rates.
Investors react to each move, but there is no clear trend, leading again to volatility and a range-bound market.
What to expect: more of the same
Unfortunately, it looks like we'll be dealing with this for the next couple of months.
Although the economy remains strong—and I expect both economic growth and inflation to pick up after a slow first quarter—we should continue to see mixed data points until at least the end of the second quarter. The expectation for earnings declines extends into the second quarter, which means we’ll see mixed news there as well, and quite possibly into the third quarter, when we hope to see earnings start to grow again.
Overall, faster economic growth should lead the Fed to raise rates later this year, but faster growth should, on balance, be good for the market. I suspect the market is poised to continue to rise overall, but it will take awhile for the trends to become clear enough for that to happen. In the meantime, we can expect the kind of market behavior we’ve seen recently to continue.


