

 Print
Print
I now have a new metaphor for chaos: 25 children running around, smacking each other with light sabers.
Let me explain. Last weekend, my wife, Nora, did the super-mom thing with our son’s Star Wars-themed birthday party, which featured a Death Star piñata and Star Wars beanbags, among other treats. But the big hit was the light sabers.
They’re simple to make: just cut a pool noodle in half, wrap one end with silver duct tape, and add some details with black electrical tape. Voilà, a light saber.
The end result was 25 boys and girls running around the back yard for 90 minutes whacking each other while the adults enjoyed beer and wine on the deck. For a parent, there are few more beautiful sights than watching that much energy burned with no one getting hurt.
That said, it was chaotic, much like the scene in Congress over the past several years. And yet, after the cake was served, peace ensued, much as it has in Washington lately.
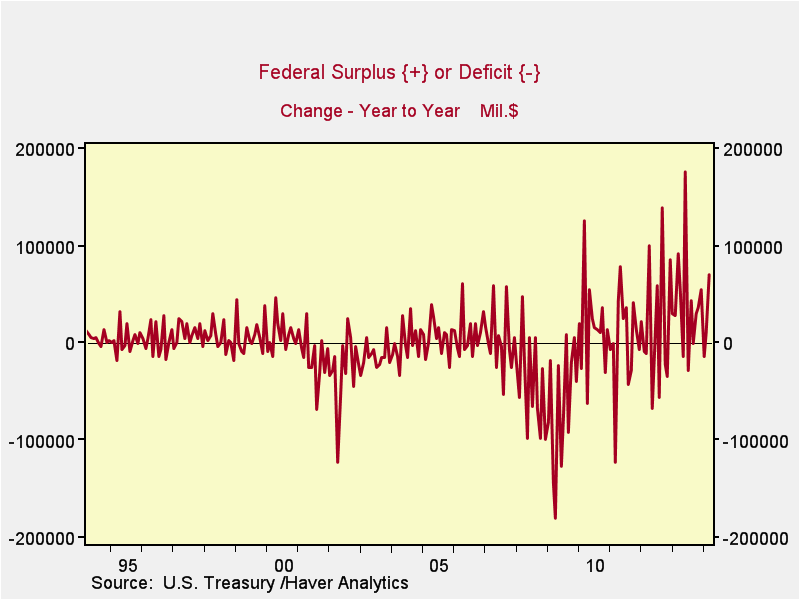
A look at the shrinking deficit
One benefit of that peace is a dramatic improvement in the federal deficit. April actually reported a surplus of $106.9 billion, due to tax collections. But on a fiscal year-to-date basis, the deficit is down 37.2 percent from last year, and the full fiscal year deficit is expected to be the lowest in six years. For the past 12 months, the deficit is near its lowest level since just before the financial crisis.
You can see this in the following chart, which shows that the improvement is well above even the levels of the mid-1990s. Mind you, we’re starting from a much deeper hole, but nonetheless, the improvements are real and continuing. (All figures are from Ned Davis Research.)
How did we get here?
First, income is up. Companies and individuals are making more money and paying more in taxes. Total receipts over the past 12 months increased 8.9 percent. Just as important, spending has been cut by 3.4 percent over the same time period. Overall, the combination of economic growth and spending cuts has led to a serious improvement.
So, are we out of the woods?
No, we’re not. But we can conceivably see the end of the forest. The chart below shows where we stand compared with the past 50 years of deficit spending.
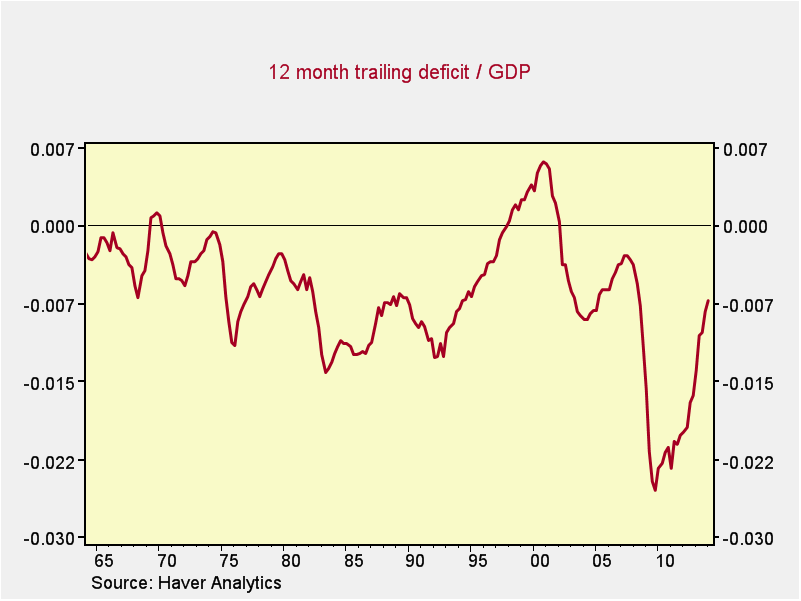
You can see that, in the aftermath of the financial crisis, we were in uncharted territory for the deficit—the fear was real. Since then, we’ve bounced back much faster than in previous crises, and the deficit is now at a level comparable with that of the 1980s and early 2000s.
The difference between then and now is the pending demographic transition as the baby boomers retire and start to draw down social security and use Medicare, which will probably require more spending cuts and revenue increases. Yet, while we face challenges going forward, we’re moving in the right direction. Just as in the past, when the deficit looked unsustainable and unsolvable (in the mid-1970s, the early 1980s, the early 1990s, the early 2000s, and 2009–2010), improvement has begun.
In fact, the deficit problem becomes more solvable every day, as the economy continues to grow—and grow faster than the deficit grows the debt (which it’s now on track to do). Of course, whether Congress will actually solve the problem is another question.
Cue the whacking.


