I’ve talked over and over about the importance of valuations in investing, and Peter Essele, CFA®, a portfolio manager in Commonwealth’s Asset Management group, does a great job of putting that idea to work with the following post. Thanks, Peter!
This year has been an interesting one for investors, especially those with a more global bent to their portfolios. As of yesterday’s close, the S&P 500 and MSCI Emerging Markets Index have returned approximately 26 percent and −3.9 percent, respectively, so far this year. That’s almost a 30-percent difference! To illustrate this, we put together the following chart, which shows the 12-month difference in returns between the S&P 500 and MSCI Emerging Markets over the last decade.
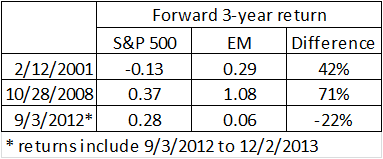
The current 12-month gap of around 30 percent is due to the strong performance of U.S. equities over the last year and lackluster performance from emerging markets. In the last decade, we’ve only hit these levels a handful of times, so we decided to take it one step further and see what forward returns looked like for each index after we breached these levels in the past.
The last three peaks occurred in 2001, 2008, and 2012. In the three years following the 2001 peak, emerging markets outperformed by 43 percent, and by 72 percent following the 2008 peak. We obviously don’t have three-year data for the 2012 peak, but emerging markets have underperformed so far, despite outperforming for a period after reaching the peak in September 2012. The interesting thing to point out, however, is that when you see an aggressive move to the upside (strong domestic performance), it usually coincides with a move to the downside (emerging markets outperformance). There’s a bit of reversion taking place.
We’re not suggesting an investment case based solely on this, but the data here would suggest that emerging markets are becoming more and more attractive as the index moves higher. Are we poised for a pullback in domestic equities or a period of strong performance in emerging markets?
We’re not sure, but valuation multiples are certainly more attractive in emerging markets these days than in domestic equities. For instance, the price-to-book ratio for emerging markets is 1.5, which is well below trend, while the S&P is around 2.6, levels last seen in 2007. The price-to-sales ratio is approaching decade highs for the S&P but is around decade lows in emerging markets. The only multiple that seems to be somewhat attractive domestically is price-to-earnings, and that’s hovering right around long-term averages.
Clearly, many factors would have to fall into place for us to see resurgence in emerging market equities. But, given the aforementioned points and the fact that emerging economies are quite depressed at the moment, it may not be a bad idea to give the space another look if you’ve been on the sidelines for a while.
 Source: Bloomberg/Commonwealth Financial Network
 Source: Bloomberg/Commonwealth Financial Network


 Print
Print


