

 Print
Print Yesterday, we talked about the latest prediction of doom—this time, a 67-percent decline in the stock market in the next 18 to 24 months. Unlike most doom-saying, which isn’t supported by any actual data (the collapse of the dollar, for example), arguments for a significant market decline are based on a number of very real facts, many of which I’ve discussed in the past.
I've never really examined the situation of a crash itself, however. What would a crash mean, and how would it likely play out?
What do we mean by a crash, exactly?
With memories of 2000 and 2008 still fresh, that might seem a silly question. In the context of history, though, both of those events stand out.
A crash is when the market goes down—a lot. To define what we mean by “a lot,” it helps to look at history. Below, I have graphed the drawdowns of the S&P 500 since 1871, using Robert Shiller’s data:
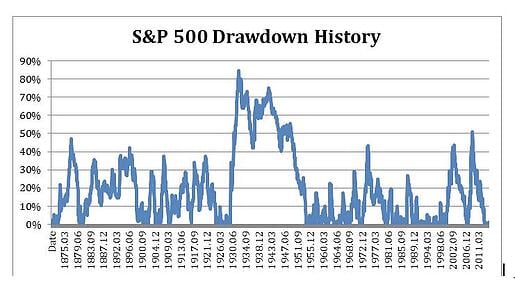
As the chart shows, up until the mid-1970s, declines of 20 percent or more—“bear markets”—were quite common every couple of years. Given this history, it seems reasonable to define a crash as a larger decline, of at least 30 percent. This would include 1973, 2000, and 2008, but exclude 1987, a hard one-day hit followed by a quick recovery.
Fewer, but more damaging, drops?
This data series reminds me a bit of forest fires. In the past, there were many small fires that cleared out undergrowth. When the Forest Service implemented a policy of preventing smaller fires, which allowed the undergrowth to build up over years, we started to see fewer but significantly more damaging blazes.
Looking at the past 30 years or so, we see the same thing in the financial markets. Bear markets, defined as declines of 20 percent or more, have been common throughout history—except for the past couple of decades. Since the early 1980s (with the notable exceptions of 1987, 2000, and 2008), there have been no such declines. In the absence of regular bear markets to clear out the deadwood, the two last crashes have been worse than any except 1973, 1897, and 1876—and, of course, the Great Depression.
Think about it: two of the biggest crashes in U.S. history occurred in a 10-year span, after a 50-year period when there was only one such crash (and that was driven by the oil crisis).
What’s changed?
Clearly, we have to consider the possibility that something has changed, and become more dangerous, in the past two decades or so. While it might be coincidence, there are too many potential reasons that crashes, rather than normal volatility, have become more common recently.
As far as predictions go, there’s no reason to call for a crash soon. But, as I've noted many times before, the market environment suggests caution. On Monday, I will look at some potential warning signs of market trouble, and what they say about the situation today.
—


