Part of the problem with the government shutdown was that many of the economic reports we rely on were collateral damage. In the absence of data, everyone (including the Federal Reserve) has been flying blind. With the government back at work, the catch-up process has begun, and the September employment data was released this morning, giving us our first look at the effects of the (then looming) shutdown. A number of private data points have also been released since then, so I think it’s now possible to start to consider the economic damage.
The news on employment is not good. Total nonfarm payrolls were up by 148,000—much less than the expected 180,000 and well below the previous month’s figure of 193,000, which was adjusted up from 169,000. On the face of it, employment growth took a real hit here. While we can’t make too much of one month, the magnitude of the decline, combined with the fact that it took place before the shutdown, suggests that the actual shutdown damage will be worse. Both the unemployment rate and underemployment rate did drop slightly, from 7.3 percent to 7.2 percent and 13.7 percent to 13.6 percent, respectively, but even that news isn’t particularly positive, as the drops weren’t driven by job gains but by changes in the workforce.
Looking at the details doesn’t make things any better. Private employment growth was down 35,000, from 161,000 to 126,000, which means 70 percent of the drop came from private employers. State and local governments added jobs, as tax receipts have improved, which helped, but the weakness in private employment is a warning sign that speaks to decreased business confidence. (More about that in a minute.)
Beyond the jobs figure, actual labor demand was similarly weak. The average hours worked figure remained unchanged, and wage growth actually slowed from 2.3 percent to 2.1 percent. Slackening wage and labor demand growth should also hurt consumer confidence.
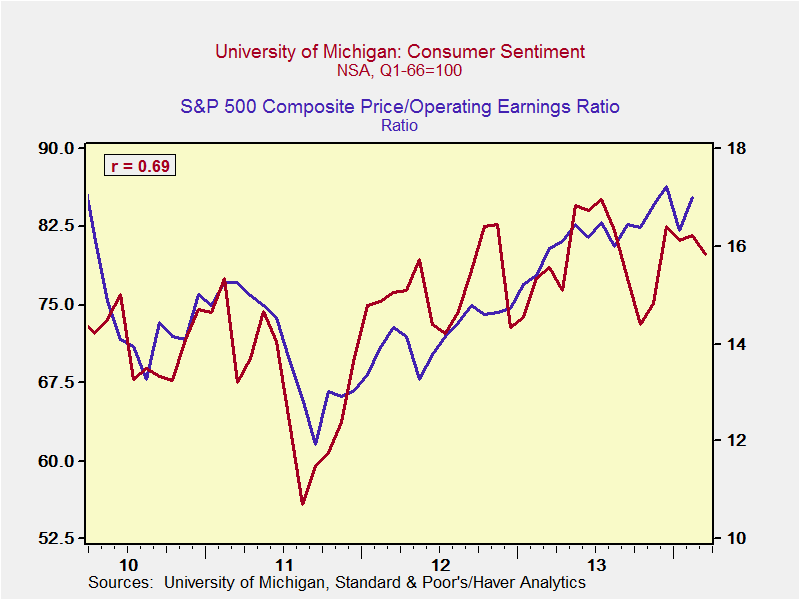
In fact, consumer confidence has taken a severe hit. Surveys have shown confidence steadily decreasing over the past couple of months, with a further decline in September as the shutdown loomed. Taking a look at the chart below, we see that this could be similar to the decline in confidence at the end of last year, as we faced the fiscal cliff.
 There’s a good article on page A4 of the Wall Street Journal today, “A Confidence Shutdown,” that delves into some more detailed data on confidence series. It draws many of the same conclusions that I’ve been making over the past couple of weeks, such as in last week’s post Assessing the Damage. In short, lower consumer confidence leads to lower consumer spending. Representing more than two-thirds of the economy, if consumer spending slows, so does the economy as a whole.
Business confidence is showing the same decline, as you can see in the following chart. The ISM composite index, which includes both manufacturing and service businesses, registered its biggest month-to-month decline since late 2008. This is significant. While the absolute level remains healthy, the trend is very much in the wrong direction and will negatively affect hiring—as we may have just seen—as well as business investment and spending.
Beyond the erosion of consumer and business confidence, the shutdown will also result in direct damage from lower home sales over the next couple of months, due to delays in processing FHA and VA mortgages and delays in IRS-provided tax receipts. Home sales were already down in September and revised lower for August, due largely to increases in mortgage rates, and the shutdown drag will worsen the situation. Delayed federal loan guarantees will also slow exports.
Overall, the initial data indications from the shutdown and debt ceiling confrontation suggest that the direct damage is real but limited. The more substantial damage going forward may be from consumers and businesses pulling back and deferring decisions to hire, spend, or invest. Now that the governmental economic data will be available on schedule again, I will be covering this topic on a regular basis. Based on what I see right now, though, the question will be how much damage the economy suffers rather than if it suffers any damage.


 Print
Print


