

 Print
Print“In spite of the cost of living, it’s still popular.” — Laurence J. Peter
The final way to compare the Bureau of Labor Statistics figures with the Shadowstats figures is to look at what the rival claims mean in terms of today’s prices. The BLS did such a comparison in April 2008. If the CPI has been understated by about 7 percent per year, then prices should have increased about 155 percent from 1998 through 2008. Has this happened? Looking at prices in general, it appears that it hasn’t. Milk is at $3.80 per gallon, not the $6.81 per gallon implied by a 155-percent price increase. Steak is at $5.28 per pound, not $9.36. The average price of a single-family home is $200,700, not $337,907. Across the board, the BLS figures seem more in accord with daily experience.
Part of the problem with comparing prices is the lack of current, comparable data points. This is part of what allows the BLS/Shadowstats divide to continue. One tool to address the gap is the Billion Prices Project, a web-based analysis system developed at MIT. According to the project’s website, “Our data are collected every day from online retailers using a software that scans the underlying code in public webpages and stores the relevant price information in a database. The resulting dataset contains daily prices on the full array of products sold by these retailers. Our data include information on product descriptions, package sizes, brands, special characteristics (e.g. ‘organic’), and whether the item is on sale or price control.”
This kind of data collection mitigates many of the problems discussed in the previous posts. As another way of looking at the problem, it also provides a reality check on the BLS figures. Comparing the CPI with the BPP figures, you can see some discrepancy, but not at the level implied by Shadowstats.
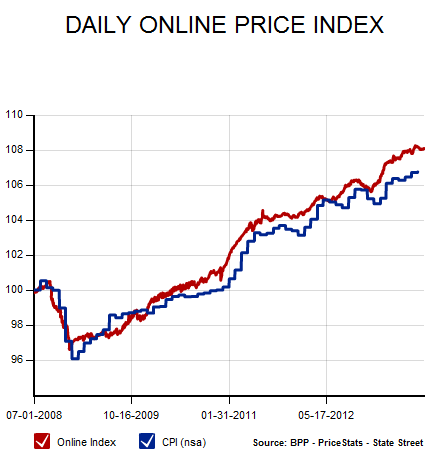
Looking at the same data in different ways, per the following charts, the BLS conclusions are also generally shown to be reasonable.
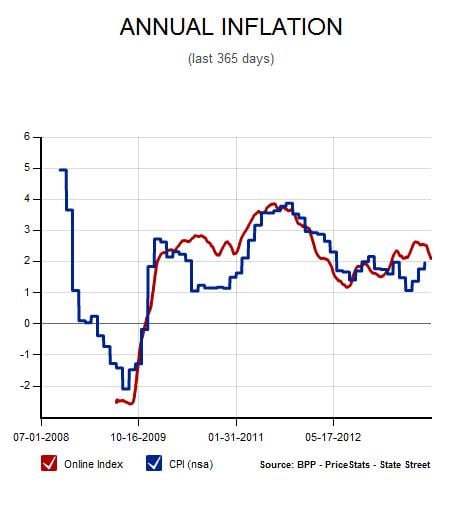
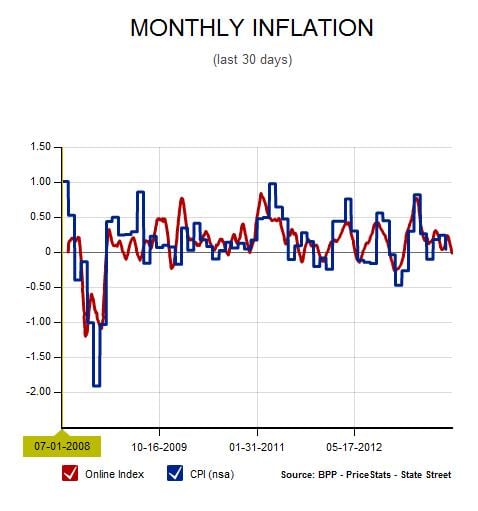
(All of the charts were taken from the BPP website, http://bpp.mit.edu, on September 25, 2013.)
What does all of this mean for you? First, the CPI figures used to adjust social security and pensions appear to be broadly accurate and can generally be expected to provide protection against declines in the standard of living going forward. Though there are probably errors baked into the system, they tend to cancel each other out. The criticisms made by Shadowstats and other services aren’t totally baseless, but the effects are much smaller than they estimate.
The second thing to keep in mind is that actual costs for each person will vary. It’s important to look at your personal spending patterns to determine whether your costs will increase in line with or differently from the CPI indices.
To some extent, the magnitude of inflation, within a contained range, isn’t that important. Small differences, compounded over time, can make a big difference, but the biggest difference to an investor or retiree is whether you’ve prepared for inflation or not. This trumps arguments over the details.
Inflation patterns aren’t set in stone, as I’ve noted in posts on health care and education. But there’s little doubt that, at a minimum, the Fed has a much higher tolerance for inflation than it has in the past couple of decades. As a result, we can reasonably expect inflation to be higher. The time to plan for this in your portfolio is now, while protection is still relatively cheap. In the near future, I’ll be posting on what inflation (using the CPI figures) has done over the past couple of decades and what we should plan for over the next couple.


