 In a recent post, I noted that demographics are a potential reason for the slower economic growth we’re now experiencing, compared with earlier growth cycles. Today, let's take a closer look at the data to see how changes in population have become a more important factor in the level of economic growth over time.
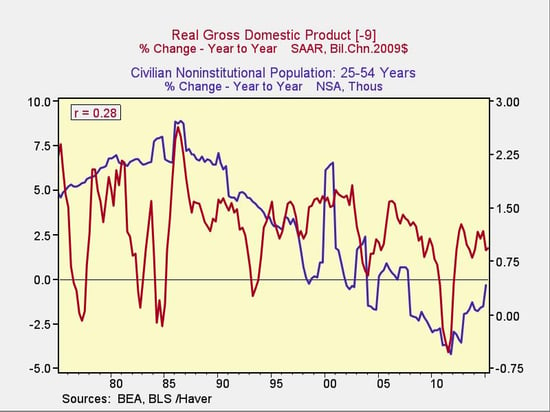
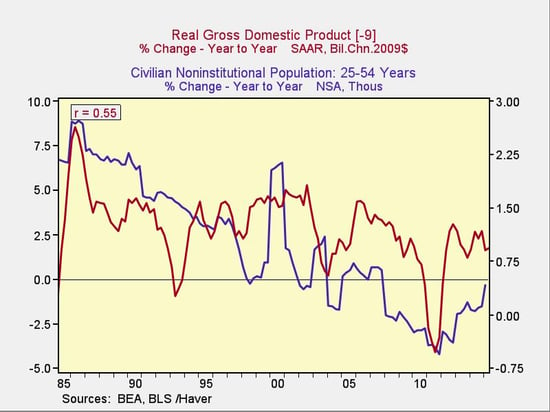
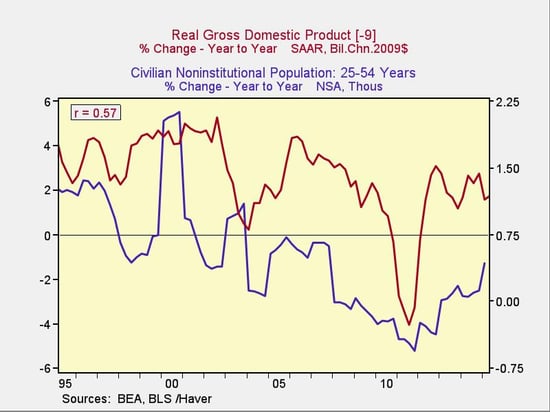
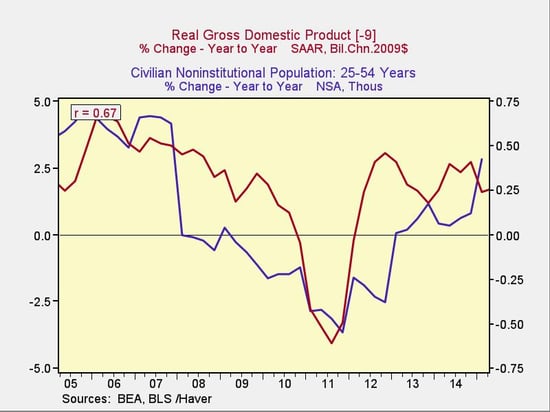
The following charts show the annual change in population in the 25–54 age group (a reasonable proxy for the primary working-age population), comparing it with the subsequent change in economic growth.
I say subsequent, because you would expect it to take some time for changes in population to make their way into the economy, and that’s exactly what we see. I've used a nine-quarter lag here (just over two years) for no particular reason except that it seems to fit the data well. What matters is the strength of the relationship, not the exact length of the lag.
The past 40 years. Looking at the 40-year period from 1975 to the present, what’s interesting is that there is relatively little relationship between changes in population and economic growth.

In the late 1970s and early 1980s, population growth was strong, but economic growth bounced all over the place. Arguably, there was no relationship during that time frame. From a numeric standpoint, the correlation of 0.28 over the full 40-year period was indicative of a relationship, but hardly definitive proof.
The past 30 years. As we narrow the time frame, though, the relationship becomes much stronger, with the correlation almost doubling to 0.55.

You can see the greater correlation, notably because population growth is declining at the same time as economic growth. Comparing this chart with the preceding one, it seems that slower population growth is consistent with slower economic growth, even if faster population growth doesn’t necessarily mean faster economic growth.
The past 20 years. Here, the trend is generally the same, with economic growth higher than would be expected in the mid-2000s, arguably because of the housing boom.

The past 10 years. Over the past decade, however, we see further strengthening of the relationship and a much closer visual match between the two data series.

What does this say about future growth?
I see two key takeaways here:
- The aging of the baby boomers out of the primary labor force over the past 10 years has been a significant headwind for economic growth. Lower population growth, other things being equal, means lower growth in spending power and spending needs.
- On the other hand, as the Echo Boomers move into this age group, the primary working-age population is now increasing again, suggesting growth will have a tailwind instead of a headwind over the next several years.
Correlation is certainly not causation, but in this case, there's a strong link between what we expect to see and what we do see. Although the news hasn’t been good for the past couple of decades from a demographic perspective, we are now poised to benefit, which should help support a faster sustainable rate of growth in the next decade.
There are reasons to be concerned about future growth levels here in the U.S., but demographics probably isn’t one of them.


 Print
Print


