 Today’s post is from Peter Essele, a manager on Commonwealth’s Investment Management and Research team.
Advisors often ask me where I see pockets of value in the market. These days, I generally respond by offering that I don't see much of value out there, and the areas that do have a semblance of a decent return or yield are those areas they should probably avoid. In other words, in an environment where just about everything is expensive, the inexpensive areas are likely that way for a reason. As such, it’s usually a good idea to avoid stretching too far for returns.
Ultimately, most of these conversations conclude with my view on the economy, which is in line with what Brad McMillan pointed out in a recent post: there’s no doubt in my mind that we’re in the latter stages of the business cycle.
So, why do I feel this way? Valuations are above long-term averages, the Federal Reserve is in tightening mode, the consumer has re-levered, and lending standards have eased. The last two points are probably talked about the least, so let’s begin there.
A re-levered consumer
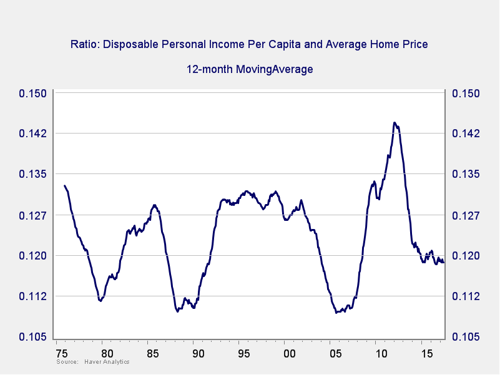
The best evidence of a re-levered consumer is in the housing market. As you can see in the chart below, the average disposable personal income stands just below 12 percent of the average home price on new purchases.

Generally speaking, when consumers purchase a home, their primary concern is the monthly payment and whether they will have enough cushion to afford other discretionary and nondiscretionary items. It would seem, then, that the monthly payment is the determining factor when purchasers are evaluating budgets to see which house or property they can afford. Which means there isn't much regard given to the debt-to-income level. With mortgage rates at multiyear lows, the interest component is also quite low. What does this mean? Consumers can take on a larger debt load on an absolute basis and as a percentage of the purchase price of the property, if lenders are willing. And this brings us to our second point.
Lending standards
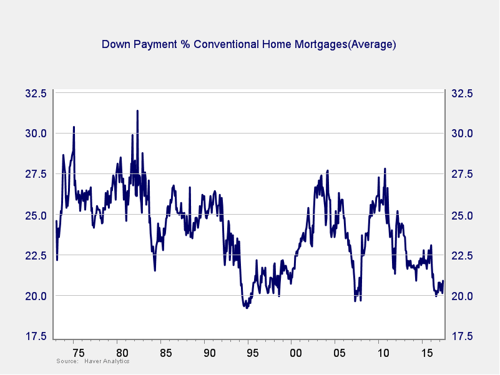
For the first time since 2007, the average down payment percentage on conventional home mortgages fell below 20 percent, as illustrated in the next chart. This figure suggests relaxed lending standards from national lenders. Furthermore, the percentage of loans closed with less than a 10-percent down payment rose to 28 last fall and currently stands at 25 percent. Compare these numbers to a post-crisis average of just 18 percent and a low of 6 percent, respectively. As of late, it appears purchasers are comfortable with larger home price tags relative to overall disposable income, while at the same time putting down less initial equity, on average.

Credit card and automobile debt
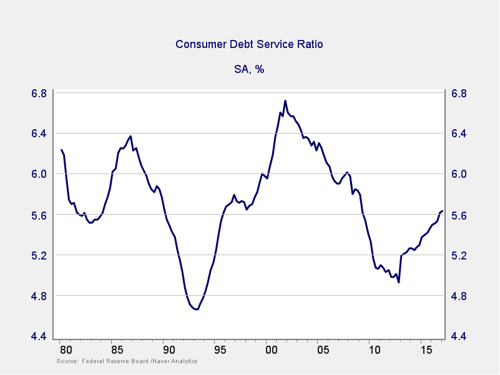
Another area where we’ve seen an uptick in leverage is credit card and automobile debt, as shown through the consumer debt service ratio in the chart below.

This ratio takes into account payments on consumer debt in relation to disposable personal income, and it is at its highest level since March 2009. Unlike fixed rate obligations such as home mortgages, however, consumer debt can be largely affected by increases in interest rates because of the floating rate component, particularly within credit cards. Therefore, continued moves higher in the fed funds rate will squeeze borrowers who have opted to fund consumption through credit card debt.
View from the rearview mirror
I believe what we’re witnessing is a situation where consumers are fueling consumption and investment through increased levels of debt compared to disposable income, and lenders have backed off on standards. These are scenarios that are often seen as late-stage developments in the economy. Plus, when you factor in overpriced investable assets and a Federal Reserve focused on reloading its interest rate holster through successive hikes, investors should probably temper return expectations in risk assets over the next three to five years. Using historical cycles as a precedent and making comparisons to the current structure of things, it feels like a majority of the runway is now in the rearview mirror.


 Print
Print


