

 Print
Print The S&P 500 is a solid benchmark for the stock market. Tracking 500 large companies, diversified by industry and sector, its movements can give you a good feel for what’s going on in the U.S. financial markets and the real economy. These are blue-chip companies with strong balance sheets and market position, and they should continue to grow and make money over time.
Good investments, right?
It would certainly seem that way. Comparing the S&P 500 and its large, stable companies with the Russell 2000, an index for smaller companies, we see a substantial difference over the past six months, especially when compared with the preceding six months.
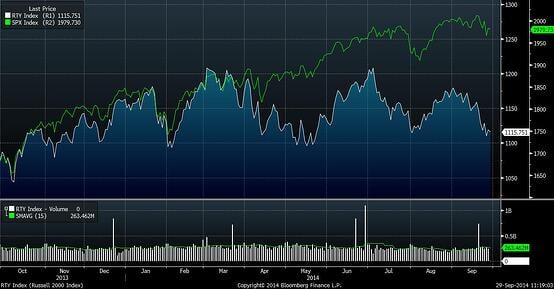
From October through March, the two indices posted fairly similar performance, but since then, the S&P 500 has dramatically outperformed.
What’s going on here?
In theory, investors respond to growth in earnings, with higher potential growth rates warranting higher prices. Other things being equal, small companies should be able to grow faster than large companies overall, and they are usually priced accordingly.
The lower prices we’re seeing for small companies suggest that investors really don’t expect growth across a wide range of businesses. This is in direct contrast to the pricing for the S&P 500. Investors see strong growth ahead for large companies and are, in fact, running prices up even further.
The S&P 500: “nifty fifty” times 10?
Looking back into investment history, the term “nifty fifty” was coined to refer to a group of 50 large-cap stocks that were considered appropriate for a buy-and-hold strategy. No matter the price you paid, the argument went, the stability and growth of these companies would make them good investments.
But that didn't exactly turn out to be the case. To quote Wikipedia, “the long bear market of the 1970s that lasted until 1982 caused valuations of the nifty fifty to fall to low levels along with the rest of the market, with most of these stocks underperforming the broader market averages . . . Because of the underperformance of most of the nifty fifty list, it is often cited as an example of unrealistic investor expectations for growth stocks.”
If you view the stock market’s performance over the past couple of years as an indication that all is well (because prices are going up), you should really take into account the six-month underperformance of smaller companies. We’ve seen prior periods when large companies outperformed small, and in most cases, subsequent performance was disappointing as large-company valuations corrected downward.
While not an immediate concern, this is one more market warning sign to be aware of, especially as geopolitical risk continues to rise—today’s protests in Hong Kong being the latest example—and the S&P 500 continues to struggle to break through the 2,000 level.


