

 Print
Print Just as I do with the economy, I review the market each month for warning signs of trouble in the near future. Although valuations are now high—a noted risk factor in past bear markets—markets can stay expensive (or get much more expensive) for years and years, which doesn’t give us much to go on timing-wise.
Of course, there are other market risk factors beyond valuations. For our purposes, two things are important: (1) to recognize when risk levels are high, and (2) to try and determine when those high risk levels become an immediate, rather than theoretical, concern. This regular update aims to do both.
Risk factor #1: Valuation levels
When it comes to assessing valuations, I find longer-term metrics—particularly the cyclically adjusted Shiller P/E ratio, which looks at average earnings over the past 10 years—to be the most useful in determining overall risk.
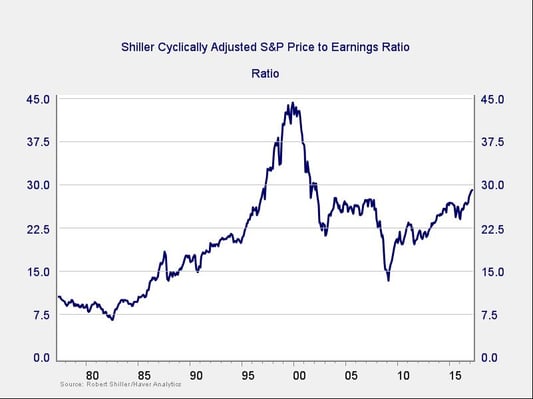
This chart is interesting for a few reasons. Since the election in November, equity valuations have increased to levels not seen since the early 2000s. They’re higher than they were in 2007 and are at the third-highest level in history, after 1929 and 1999. Additionally, volatility in March did little to lower valuations. The market, by this metric and many others, remains very expensive.
Although they’re at their highest level in 15 years, valuations remain below the 1999 peak, so you might argue that this metric is not suggesting immediate risk. Still, comparing where we are now to 2000 bubble conditions isn’t exactly reassuring.
Risk factor #2: Changes in valuation levels
As good as the Shiller P/E ratio is as a risk indicator, it’s a terrible timing indicator. One way to remedy that is to look at changes in valuation levels over time instead of absolute levels.
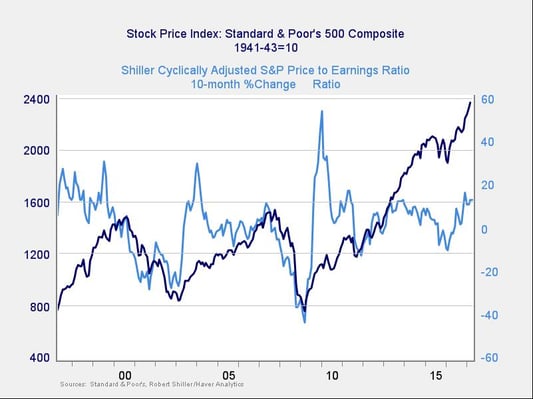
Here, you can see that when valuations roll over, with the change dropping below zero over a 10-month or 200-day period, the market itself typically drops shortly thereafter. The post-election rally has kept changes in valuations at a healthy level, with few signs of immediate risk.
Risk factor #3: Margin debt
Another indicator of potential trouble is margin debt.
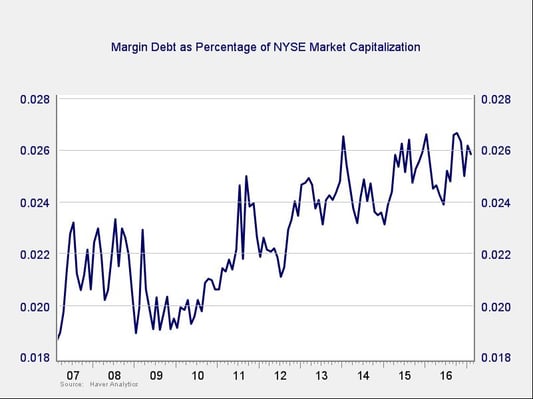
Debt levels as a percentage of market capitalization remain near all-time highs, although growth in this indicator may be slowing. The overall elevated levels of debt are concerning, but given recent improvements, this is not necessarily an immediate risk.
Risk factor #4: Changes in margin debt
Consistent with this, if we look at the change over time, spikes in debt levels typically precede a drawdown.
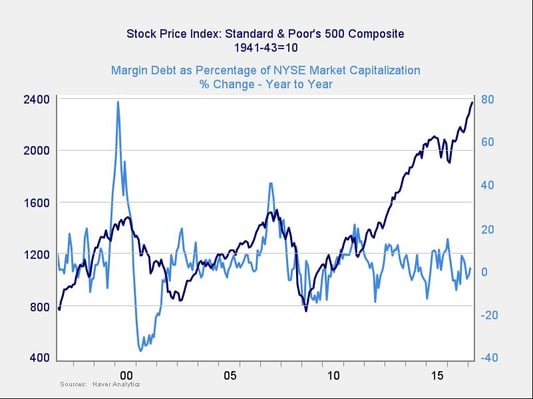
As you can see in the chart above, the change in debt as a percentage of market capitalization remains at low levels. Though the absolute level of margin debt is high, and so is the risk level, the trigger for immediate risk seems to be getting farther away.
Risk factor #5: The Buffett indicator
Said to be favored by Warren Buffett, the final indicator is the ratio of the value of all the companies in the market to the national economy as a whole.
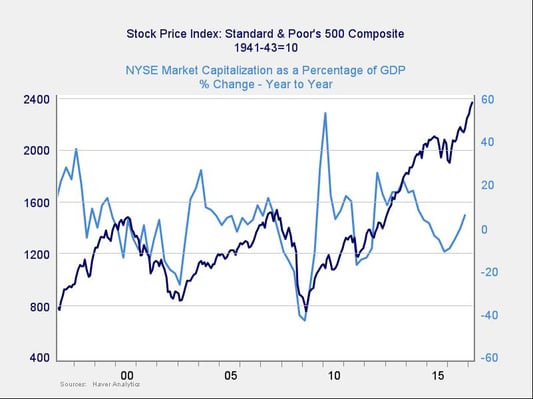
On an absolute basis, the Buffett indicator is actually somewhat encouraging. Although it remains high, the year-on-year change (shown above) is still well below the risk zone. The index has increased post-election, however, and the trend suggests we may be heading into more risky territory, so any increase should be watched.
Technical metrics are also reasonably encouraging, with all three major U.S. indices well above their 200-day trend lines. Even as markets hover near all-time highs, it’s quite possible that the advance will continue given growth in earnings and positive consumer, business, and investor sentiment. A break into new territory could actually propel the market higher, despite the high valuation risk level.
Risk is high (but not immediate)
Although many of the indicators point to an elevated risk level, they do not signal an immediate problem. Given improving economic fundamentals and earnings, and very positive consumer and business sentiment, we may well see the markets—and risk levels—continue to increase.
High risk is not the same as immediate risk, and although there's reason for concern, the indicators that are best at predicting immediate risk are not in the danger zone. The most likely course for the market in the near term is sideways, but it could take a turn upward if good news, such as positive earnings surprises, appears.


