

 Print
Print As we discussed last week, market crashes (defined as drops of 30 percent or more) have become more common recently, while the smaller declines known as bear markets (drops of about 20 percent) have become less so. With two major crashes in the past 10 years, it seems like a good idea to examine some of the factors that preceded them.
Are there any warning signs that we should be keeping an eye out for?
Valuation levels
One key factor seems to be market valuations. Let’s take a look at some older data first:
- In 1929, the cyclically adjusted price/earnings ratio (aka the Shiller ratio) peaked at 32.56, over twice the average (at that time) of 14.83.
- In 1937, the second wave of the Depression, valuations peaked at 22.24, for a premium of more than half.
- In 1973, valuations hit 18.71, against an average (at that time) of 15.19, for a premium of almost a quarter.
Now, let’s look at more recent data:
- In 1987, the market hit a valuation of 18.33, as compared with a postwar average of 14.52 (a 26-percent premium).
- In 2000, the market was valued at 43.83 versus 16.35 (more than 250 percent higher).
- And in 2008, it was valued at 27.54 against an average of 18.03 (a premium of greater than 50 percent).
What does this data tell us?
The average valuation level of stocks has increased significantly since 1987. The postwar average at that time was 14.52, and it has climbed to 18.41 as I write this. Think about that: the average valuation levels of the market have increased by over a quarter in the past 30 years. (We’ll come back to this point tomorrow.)
For our immediate purposes, though, we can observe that the current Shiller P/E ratio of 25.69 is 41 percent above the postwar average. On a percentage basis, this is clearly in the danger zone, based on prior crashes. (Note that I’m sidestepping the argument about changing valuation levels here, as I’m only comparing the current level to an average.)
But valuation levels alone are not good trading indicators, as overvalued conditions can and do persist for years. They have been present, though, for all of the crashes we have identified, so we can consider them necessary but not sufficient conditions. We need to look for a catalyst that would take these high valuation conditions and start a decline.
Interest rates
By one of those fortunate coincidences, just as I was starting to research the effects of interest rate hikes on the market, an article by Steve Blumenthal showed up on my desk courtesy of Streettalklive.com. In it, I found this chart:
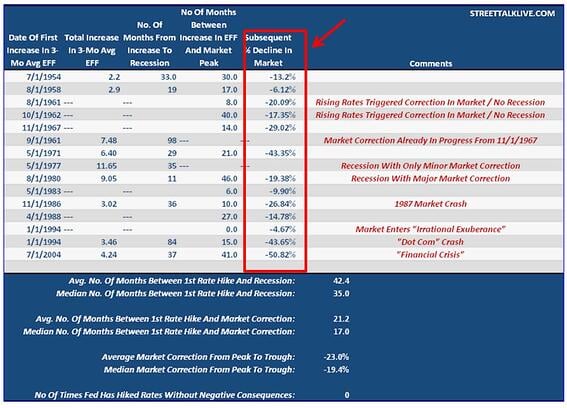
The data here doesn’t go as far back as I’d like, but it does cover the postwar period, showing us two important things:
- First, interest rate increases were present for all of the crashes we discuss.
- Second, like valuations, rate increases seem to be necessary but not sufficient conditions for a crash. In other words, there can be a substantial lag between the start of rate increases and the actual market decline.
Clearly, with talk now centering on when, rather than if, the Fed will hike interest rates, we should expect to see rates head higher over the next couple of years. If the chart above is any guide, rising rates will guarantee at least a correction—but we won’t know when.
Margin debt
One final indicator that may prove useful is the change in debt balances used to buy stocks. Looking at the chart below, we can see that margin debt jumped by 50 percent or more year-on-year about a year before each decline over the past 30 years.
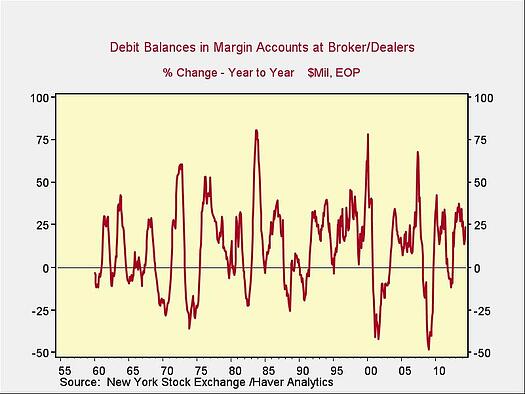
Recently, we haven’t seen that jump, which suggests a crash is not imminent.
What do these indicators tell us?
Overall, we can clearly see that the potential for a crash exists, based on the valuation environment and the pending Fed rate hikes. The good news is, these indicators show no signs of it happening any time soon. Factors to keep an eye on include margin debt and interest rates, as well as market behavior, which we’ll talk about tomorrow.


