

 Print
Print With oil prices down as much as they are, many investors are asking whether now is the time to buy. “Buy low, sell high” makes a lot of intuitive sense, and with prices low, buying looks like a good move.
It’s important to make a distinction here, though, between trading and investing:
- Trading means buying or selling based on expected short-term results.
- Investing, on the other hand, is longer-term in nature, based on an evaluation of fundamentals.
You could oversimplify and say one is technical, based on price action right now, and the other is based on an analysis of the fundamental business over time. Let’s look at oil from both perspectives.
The trading view
Stock prices in the energy industry correlate pretty closely with the price of oil, which makes sense. In the following chart, we see that oil prices are at five-year lows and that the last time they dropped that far, there was a subsequent bounce.
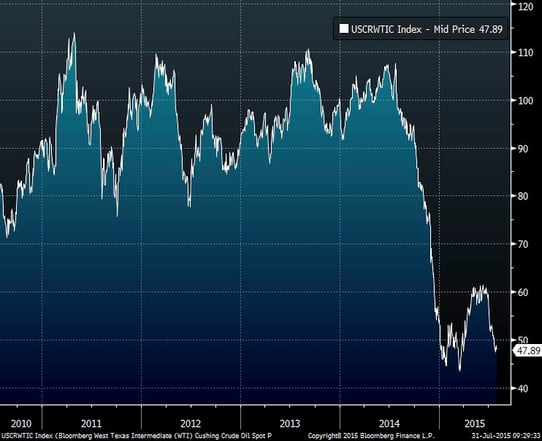
From a trading perspective, then, it might be time to take a position and hope for a bounce upward.
Something else the chart demonstrates, however, is the risk of looking at a data set that’s too small. Let’s expand the chart to a longer time period.
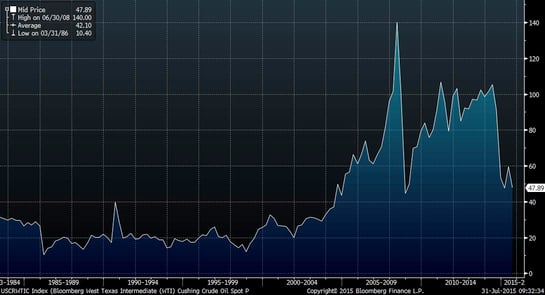
Looking at the data from 1983 to now, we see that, over quite a lengthy time frame, the default price of oil was around $20 per barrel. Counting on a bounce is essentially saying that something fundamental changed in 2005 or so that will keep oil prices above what was, until then, their ceiling.
Should we expect a bounce? In fact, several things did change in the 2000s. From a supply perspective, the European Union agreed to start imposing sanctions on Iran, which were fully extended to an oil embargo in 2012. The U.S. already had sanctions in place, dating from the mid-1990s, when you can see prices start to increase. With the European sanctions, you can see oil prices spiking even faster until the financial crisis.
Prices went up, predictably enough, with the removal of a substantial source of supply and then recovered even in the face of growing U.S. production in the early 2010s. But once American production grew to the point that the U.S. became the price setter, instead of OPEC, prices crashed again. It looks like what might have changed, then, was the removal of a significant source of supply.
At the same time that supply declined, demand went up with the explosive growth of China and other emerging markets. With demand growing quickly and supplies down, prices, of course, went up. When Chinese growth slowed, however, and the missing supply was replaced (in this case by growing U.S. production), prices moved right back down.
What does this mean today? For the price of oil to rebound in a significant way for an extended period, either demand has to grow substantially or supply needs to drop. With Saudi Arabia and OPEC declining to constrain their own supply, the U.S. oil industry continuing to grow production through process improvements even as the number of wells drops, and Iran potentially coming online, a meaningful supply drop seems unlikely.
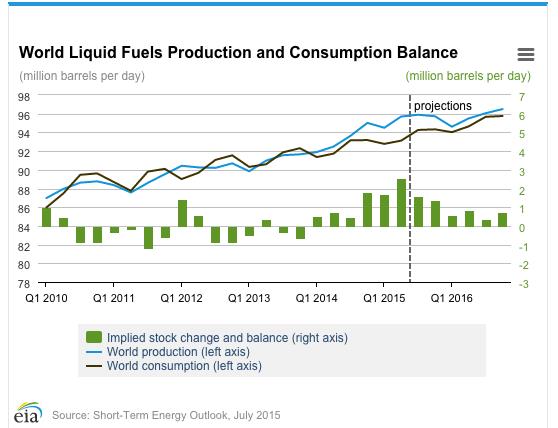
Meanwhile, as Chinese growth continues to slow and emerging markets confront their own issues (not to mention slow growth in Europe and the U.S.), demand also seems unlikely to spike. Although demand is projected to increase, that increase should be less than the expected growth in supply. In fact, the U.S. Energy Information Administration forecasts that production will continue to exceed demand for at least the next year.
The fundamental view
Over the next year or so, the current conditions, with supply in excess of demand, are unlikely to change for the better from an oil company perspective. In fact, there is a reasonable chance they’ll change for the worse if the Iran deal is finalized and that country moves back into the oil markets. Longer term, things do not, in my opinion, look a whole lot better, as the rise of alternative energy continues.
Conclusion: not a sure bet
If you want to invest in energy, you might make a short-term bet on a bounce in oil prices, which seems quite possible. But a bet on a medium-term recovery to the levels of most of the past five years does not seem as promising. Opportunities will certainly present themselves as the industry consolidates in the face of lower prices, but they will likely be company-specific and not industry-wide.
Unfortunately, investing in energy doesn’t look as easy as a bet on oil prices.


