

 Print
Print We talked the other day about slow failure in investing, when a portfolio simply can’t generate the expected returns over time. Although investors may do well on average, the mismatch between expected returns and actual results can spell failure for some who are in the market at a poor time.
Slow failure can happen in two ways:
- If the actual market returns—and I’m using the stock market as a proxy for portfolio returns—are below expectations
- If market returns are in line with expectations but blow up during the holding period
My previous post focused on the first way, but the second may offer a clearer picture of the problem.
Let’s look at the last 20 years
The chart below requires some explanation. The blue line represents total returns for the S&P 500 over the preceding five years, and the red line is the S&P 500 itself. The red line goes off the numbers on the left, the blue line on the right. Unsurprisingly, when the index drops significantly, returns drop, too.
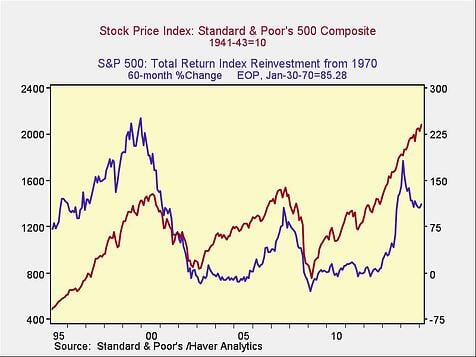
Looking at the chart, we can see that the declines in 2000 and 2008 both knocked trailing five-year returns (which are total, not annualized) below zero for extended periods in the mid-2000s and early 2010s. In other words, over the past 20 years, it has been the significant market declines—the fast failures—that have led to multiyear slow failures.
This makes sense: a substantial decline of 30 percent to 50 percent will hit returns over a long time frame. As you can see above, it can erase the gains for a significant time before the drawdown and result in multiple years of returns around zero. In fact, if you look at it, 8 out of the past 20 years had trailing 5-year returns of around zero.
Ponder that for a minute. Almost half of the time, in the past 20 years, the total S&P 500 return over 5 years was about zero. We don’t think of it that way, of course, because the times in between—the late 1990s, the mid-2000s, and the past five years—have seen the market rise at incredible rates. Boom and crash, with a bit more boom than crash.
What it all means for investors
This is why fast failure puts paid to the average results we talked about earlier. This is why both slow and fast failure can bite retirees even as average returns remain healthy. The technical name for this problem is sequence of returns failure, which is another way of saying that gains and losses are asymmetric.
To put that in real-world terms, with the market dropping 50 percent in 2008, you needed a 100-percent gain to get back to even. We got that gain, and more, of course, but investors spending down their portfolios were working off a lower base. They haven’t recovered yet, and they may not.
To address both the slow and fast failure problems, then, we need to look at how to solve the fast failures, the drawdowns. Is this possible? I believe it can be, and we’ll talk about that next.


