

 Print
PrintAs we enter the month of September, it’s time to take another look at the economic forecast, focusing on factors that have proven to be reliable indicators of economic trouble ahead. As expected, the data hasn’t changed much from last month—it’s encouraging in almost all areas and has even improved in some cases.
The Service Sector
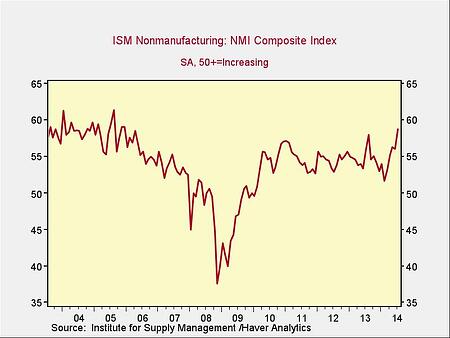
Signal: Green light
This data point has popped up significantly to an eight-year high—the highest level since the financial crisis. This strength is especially encouraging following the first-quarter weakness, suggesting the recovery is fully back on track.
Private Employment: Annual Change
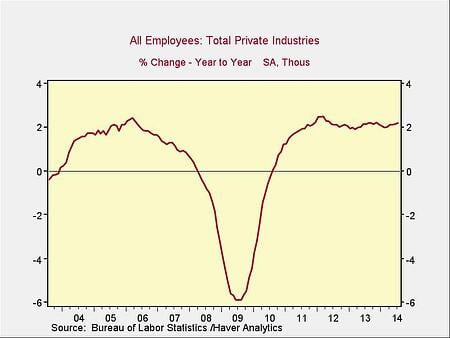
Signal: Green light
Private employment year-on-year has continued its unhurried increase after the first-quarter slowdown. Because this is an annual figure, the changes are slower and smaller than for more frequently reported data, but the trend continues to be in the right direction.
Private Employment: Monthly Change

Signal: Green light
These are the same numbers as in the previous chart but on a month-to-month basis, which can provide a better short-term signal. The monthly change was down a bit but remains in a healthy zone, extending the series of months with 200,000-plus job growth to the longest run since the late 1990s.
Yield Curve (10-Year Minus 3-Month Treasury Rates)
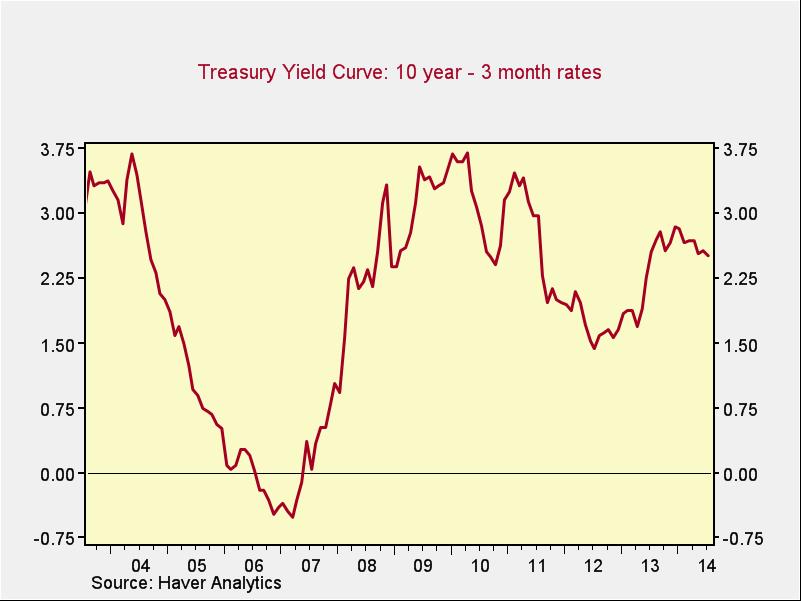
Signal: Green light
Once again, rates ticked down over the past month, but the spread remains at healthy levels. Lower rates seem largely due to the “flight to safety” as European risks rise, but the positive effect is the same.
Consumer Confidence: Annual Change
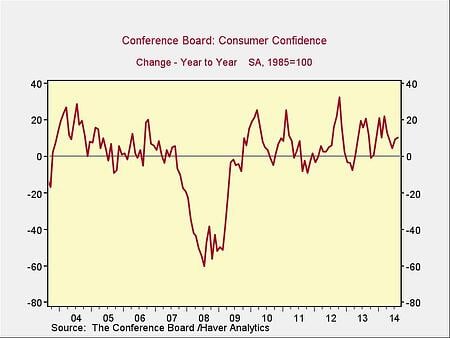
Signal: Green light
Consumer confidence reached its highest point since the financial crisis, a seven-year high. Despite declines over the past couple of months, this indicator has moved back to a full green light.
Economic Forecast: Continued Strength
All of the major signs continue to be positive, with several indicators reaching multiyear highs. Economic growth remains well supported across the board. Although international turmoil is a risk, the domestic economy continues to move ahead strongly.


