Print
PrintOnce again, it’s time for our monthly update on risk factors that have proven to be good indicators of economic trouble ahead. As expected, the data hasn’t changed much from last month—it remains positive in almost all areas and has continued to improve in many cases—but it’s still important to keep an eye on things.
As we move into the year, though, the economic forecast remains positive.
The Service Sector
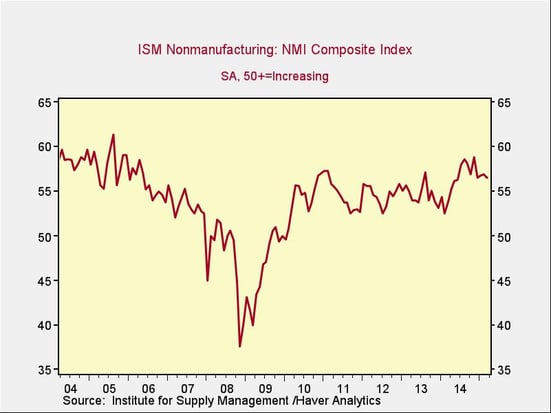
Signal: Green light
Despite dropping slightly in the past two months, this data point remains close to its highest level since before the financial crisis. Continued strength in the service sector is consistent with business confidence; as a representative sample of the largest sector of business, this is an important leading indicator.
Private Employment: Annual Change
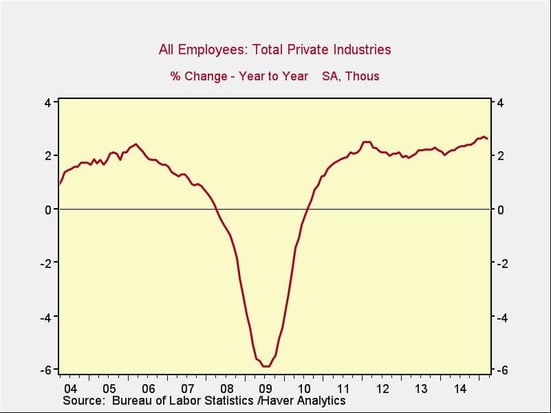
Signal: Green light
Despite a weak March jobs report, private employment growth year-on-year continued to increase, remaining close to its highest point since 2012. Because this is an annual figure, the changes are slower and smaller than those we see in more frequently reported data, but the trend continues to be in the right direction.
Private Employment: Monthly Change
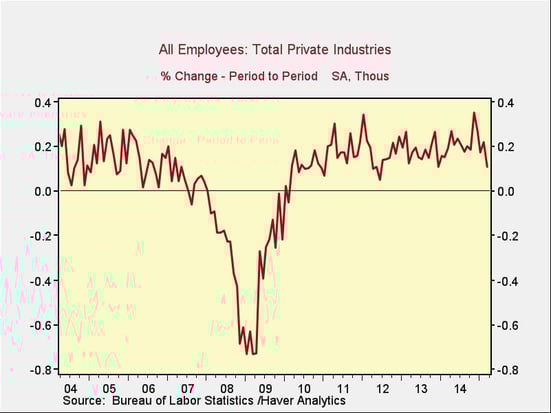
Signal: Green light
These are the same numbers as in the previous chart, but on a month-to-month basis, which can provide a better short-term signal. Despite the disappointing March report, employment remains at a growth level consistent with the mid-2000s, and total employment growth continues to be healthy.
Yield Curve (10-Year Minus 3-Month Treasury Rates)
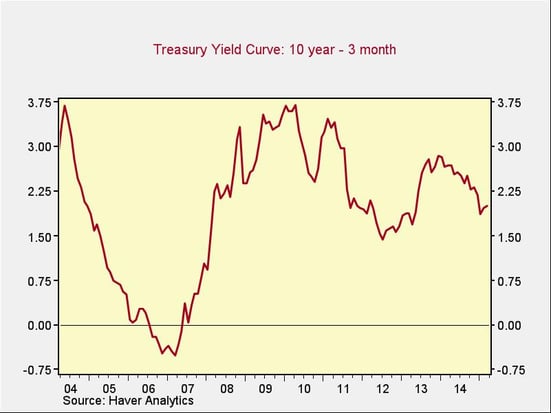
Signal: Green light
The spread between the 10-year and 3-month Treasury rates ticked up slightly over the past month but remains at healthy levels. This metric hasn’t changed significantly despite the anticipated Federal Reserve rate increase, which seems to be due at least in part to demand from international buyers.
Consumer Confidence: Annual Change
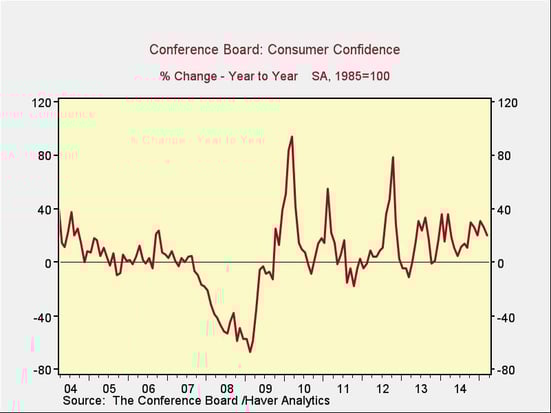
Signal: Green light
Consumer confidence decreased slightly this month but remains at one of the highest points since the financial crisis, well above levels of a year ago.
Conclusion: Steady as She Goes
All of the major signs continue to be positive, despite several recent weak economic reports. The decline in interest rates appears to be due largely to international demand; whatever the reason, however, it has supported continued U.S. economic growth. Lower oil prices also continue to bolster the economy, which remains well supported across the board.