Print
PrintIt’s time for our monthly update on factors that have proven to be reliable indicators of economic trouble ahead.
As expected, the data hasn’t changed that much from last month—it’s encouraging in almost all areas—but it remains important to keep an eye on things.
The Service Sector
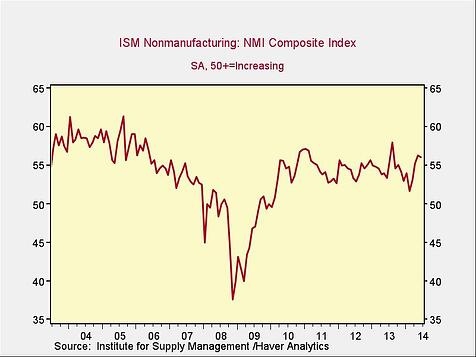
Signal: Green light
Despite a slight downtick in the most recent data, we remain well above the trouble level—and higher than the weak first quarter, as well as almost all points since the crisis.
Private Employment: Annual Change
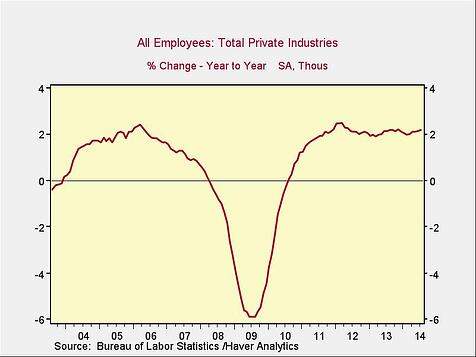
Signal: Green light
Private employment year-on-year has actually ticked up a bit in the past month, continuing to grow at a pace close to that of the mid-2000s. Interestingly, even during the weak first quarter, job growth maintained about the same pace, which is a positive sign.
Private Employment: Monthly Change
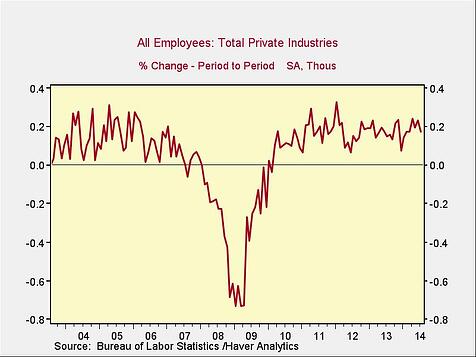
Signal: Green light
These are the same numbers as in the previous chart, but on a month-to-month basis, which can provide a better short-term signal. The monthly change was down a bit but remains in a healthy zone, extending the run of months with 200,000-plus job growth.
Yield Curve (10-Year Minus 3-Month Treasury Rates)
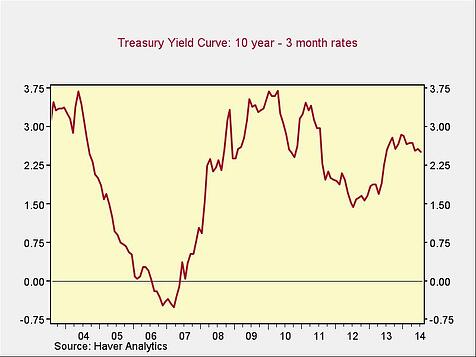
Signal: Green light
Rates ticked down over the past month, but the spread remains at healthy levels. Taper notwithstanding, the Fed is still pushing money into the system, and the difference in interest rates continues to support the economy.
Consumer Confidence: Annual Change
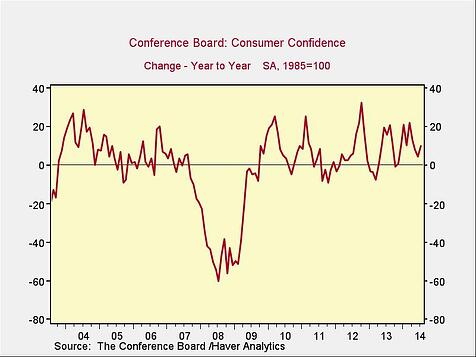
Signal: Greener than last month
Last month’s signal was green with a yellowish tinge, but we’ve seen a bump up since then, which is reassuring. Consumer confidence is still an area to watch, but we can probably chalk up the previous decline to the weak first quarter.
Economic Forecast: Sunny Weather
As we head into August, the economic forecast remains sunny, with none of the usual indicators of a slowdown close to the trouble zone. Although consumer confidence has moderated somewhat, it looks like a short-term effect rather than a serious problem.
This month, the signs suggest we’re set to enjoy an uninterrupted (at least by the economy) time at the beach. Have fun!