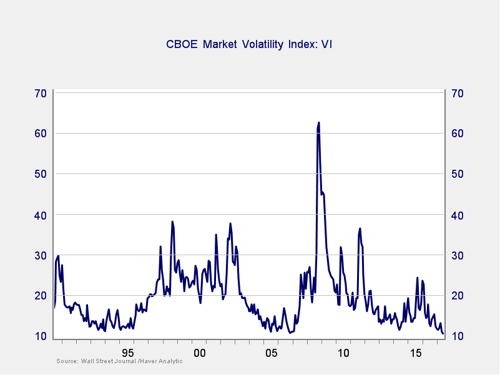
 To start, for those of you wondering exactly what the “VIX” is, formally, it is an index of expected volatility in the returns of the S&P 500 Index. It’s calculated based on the prices of eight different put and call options. If that doesn’t mean much, it might help to think of the VIX as a fear index. When the market tanks, the VIX rises; when the market is smooth—and expected to remain so—the VIX is low. In other words, low VIX equals low fear.
Measures of risk
You can see this concept illustrated in the chart below. When times are good, and when investors are not worried, the VIX is low. Look at the mid-1990s, the mid-2000s, and, of course, now. When investors get scared, the VIX spikes, as you can see in the late 1990s, around 2003, and in early 2016. This is a good measure of how worried investors are. Like many other indicators, however, it's not a good timing indicator, but it is a good risk measure. When investors get complacent, historically trouble has come calling within the next couple of years.

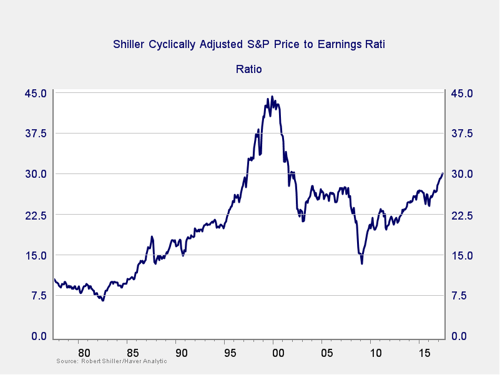
Another good indicator, which we look at regularly, is the Shiller price/earnings ratio. This is the price tag for the stock market. As with the VIX, it’s a good indicator of risk but not a good timing indicator. We have talked about this one extensively, so I won’t go into the details. But in the chart below, you can see the spikes before 1987 and 2000, the high level leading into 2007, and, of course, the high level now.

A complete picture
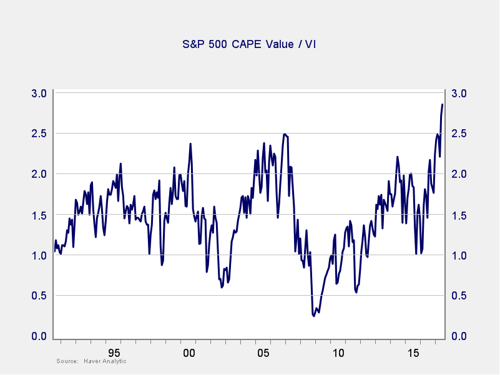
Both of these indicators are worth looking at, but they don’t give a complete picture of the market environment. Let’s combine them, dividing the level of valuation by the level of fear, as shown in the next chart.

What we are doing here is comparing price risk with the perception of price risk. In theory, the higher the price level, the higher the downside risk, and the more worried investors should be. In practice, this works as well: you'd walk much more carefully on a narrow bridge over a 100-foot drop than you would over a 2-foot drop. The real risk—and, possibly, the immediate risk—comes when risk is high and investor caution is low. This is what we are capturing in this chart—that is, the risk of tripping and falling much farther than you thought you could.
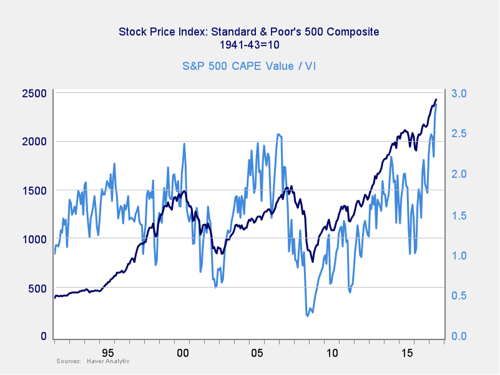
In practice, this combination does exactly what we had hoped, turning two poor timing indicators into a much better one. In the chart below, you can clearly see that when the light blue line (the price-to-fear ratio) spiked and rolled over in 2000 and 2007, the market followed shortly thereafter. You can see the same, although less clearly, in 2015/2016. The same applies at a couple of points in the 1990s, although it is hard to see at this scale. Overall, though, a spike in the price-to-fear ratio, especially to a level over 2.5, looks like a reasonable indicator of trouble in the next year or so, based on this history.

Does this make sense in theory? It does. Valuations are driven to high levels by investor optimism, stay there on investor complacency, and start to drop only when investors get scared. Combine that dynamic with high valuations, where prices have farther to fall, and you can see why a high ratio can be a signal of trouble ahead.
This, of course, brings us to today. The value-to-fear index is considerably higher than it was in either 2000 or 2007, and on a recent spike upward, it is well over the 2.5 level. That spike, as you can see from previous charts, is not driven only by a high valuation level—the market is very expensive, but nowhere close to 2000 levels—but also by a drop in fear that's close to record lows.
What’s the takeaway?
My takeaway is this: investors are not nearly as nervous as they should be. I have seen this even in analysts whom I respect highly, who have essentially signed off that indeed things are different this time.
Maybe so. They are certainly correct right now and may well continue to be right for some time. At the same time, though, I would look at the history here, as well as the many similarities to the late 1990s, and recall the wisdom of the noted investment expert Wednesday Addams: “Be afraid. Be very afraid.” As good as things are right now, investors should still be more nervous than they are.


 Print
Print


