

 Print
Print Yesterday, I saw an interesting doom-and-gloom piece on rising rates, which claimed that rate increases typically sink the stock market and that we could potentially expect a crash in the near future.
Theoretically, this isn’t crazy; higher rates should lead to lower stock prices. In practice, though, higher rates typically reflect a strengthening economy. The effect on stock prices is a battle between the tailwind of faster earnings growth from an improving economy and the headwind of higher rates. Only in the absence of the tailwind does the headwind become significant.
There are real problems with rising rates, principally in emerging markets that have borrowed extensively in dollars, but here in the U.S., higher rates are increasingly a consequence of an improving economy. Rather than a promise of impending trouble, they’re a sign of ongoing success.
What does history tell us?
Let’s take a peek into the past to see how rising rates have actually played out in relation to stock market performance.
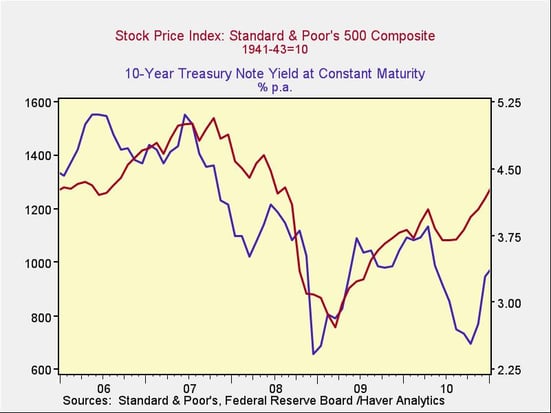
Looking at the period from 2006 through 2010, we see that rates and stocks moved more or less in tandem, the opposite of what theory would suggest, at least until the end of 2010. Especially in 2009, rising rates did not preclude rising stocks, showing that a short-term relationship can be positive rather than negative.
Over a longer and more typical period, the last 10 years, we do see a negative relationship, as we would expect, but it is not very strong. The correlation of −0.27 says that rising rates may drive stocks down, but not very much at all, at least at the moment they change.
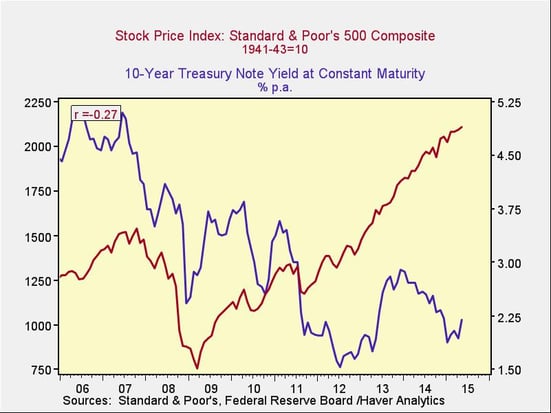
This is where things get interesting. Interest rates do affect stocks, but not very much at the moment rates change. If you think about it, though, it takes time for changes in rates to move through the economy, so we should expect a lag.
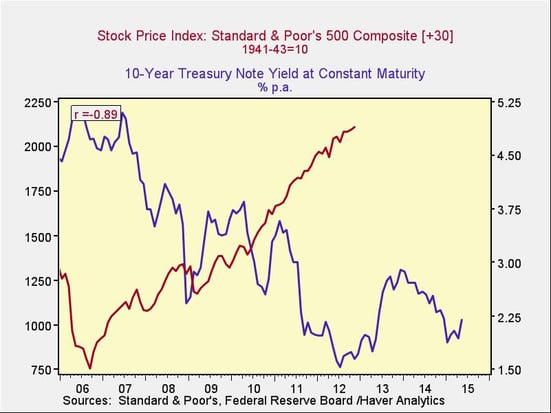
What does the relationship look like if we compare changes in rates with changes in stock prices at a later period? This chart shows the past 10 years with a 30-month lag, the point at which the relationship is at its strongest. Here, there is almost a 90-percent negative correlation between interest rates and stock prices.
This really does show that when rates rise, stocks eventually go down, consistent with economic theory. Not only that, the relationship persists beyond the past 10 years. Looking at the past 30 years with a 30-month lag, we see essentially the same relationship and the same correlation.
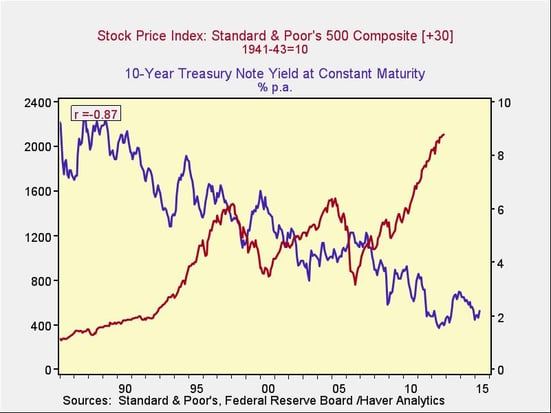
From a fundamental standpoint, this makes a lot of sense. The initial rise in rates is typically a response to an improving economy, which drives stocks higher. On average, it takes two to three years for the economy to start to overheat and for rates to get high enough to start to choke off growth—which is when stocks decline. This is exactly the pattern we see here.
Bottom line: rising rates not an immediate threat
Although higher rates will probably hurt the market eventually, that point is likely a couple of years away. In fact, rate increases early in the cycle are typically associated with continued market rises rather than declines. Plus, although rates have increased, they haven’t really moved above levels typical of the past several years.
Overall, rising rates will no doubt create problems, especially in foreign markets. Here in the U.S., though, there should be no direct concerns for a while.


