

 Print
Print As I mentioned yesterday, it’s worth comparing the current recovery with the past two, to get some sense of perspective, and that extends well beyond comparing the employment numbers.
In fact, by looking at the fundamental sources of growth in each era, we can get a much better idea of how healthy—or not—the current recovery is.
After spending quite a bit of time examining the three periods, I’ve reached the following conclusions:
- The 1990s, especially up to around 1998, was a real boom. It morphed into a bubble at the end, but for much of the time, growth was driven by fundamentals.
- The 2000s looked like a boom, and kind of acted like one, but wasn’t. Unlike the 1990s, 2000s growth was based on an expansion in mortgage and consumer lending (i.e., people spending money they didn’t have).
- The current recovery, I believe, looks much more like the 1990s than the 2000s, and stands to be more sustainable and more real, albeit slower to start.
I base my case on the following factors:
Job creation is none too shabby
I’ve made this point before, but job creation over the past 12 months, even with the recent disappointing report, remains above any period in the 2000s and is approaching 1990s levels.
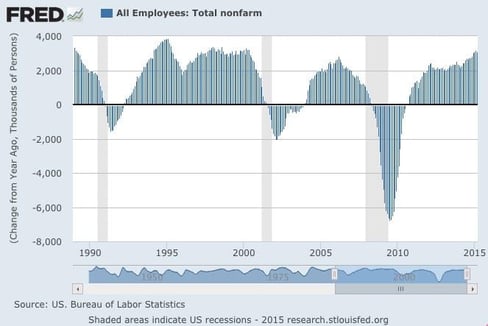
As the chart shows, we’ve already seen a longer period of annual job gains above 2,000,000 than we saw in the 2000s, plus a recent acceleration. The question is whether this will be sustainable, and that depends to a large extent on consumer spending.
Wage growth is on an upswing
Wage growth has been one of the headline worries. Problem is, the data only extends back to 2006. To gauge whether consumers will be able to spend, we need a data set that covers all three periods of interest. Here, I use the wage and salary compensation series, which represents actual wages and salaries paid.
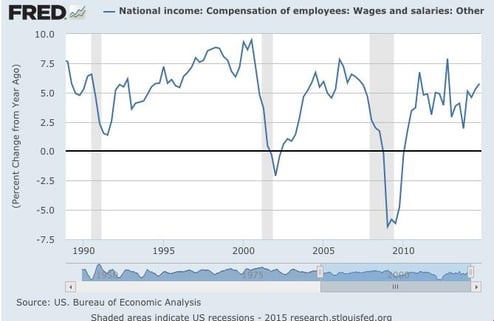
You can see two things in the chart above. First, while the current recovery has been choppy, it’s been improving recently. Second, the early 1990s also had a choppy period. Wage growth is an area that remains weak, but not so weak as to be inconsistent with previous recoveries. Moreover, it’s improving up to levels we saw in the mid-2000s and early 1990s. Actual wage growth actually isn’t that bad.
Higher savings rate could be a plus
Another relevant data point is savings, which ties the ability to spend into the willingness to spend. Savings do more than limit current spending; they enable future spending growth. For this reason, they’re key to understanding both current and future growth levels. In this chart, I included growth in the economy, to highlight that point about the current period versus both the 1990s and the 2000s.
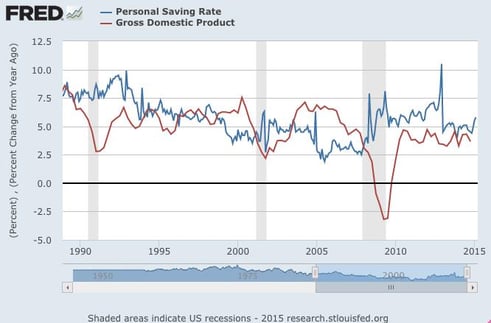
Look at the early 1990s. Savings rates were high and growth was low, but that saving led to a sustainable higher level of growth—until the end, when bubble conditions kicked in with higher growth based on borrowing. You can see that in the disconnect between (higher) growth and (lower) spending at that time.
In the early 2000s, we briefly see higher saving and lower growth, which enabled higher growth levels, but that switched very quickly to borrowing-driven growth, with results that we now know.
Back to today, the picture looks more like the early 1990s. Consumers have saved, and growth has been slower but well supported. Much like the early to mid-1990s, savings continue to support growth. Unlike in the late 1990s and 2000s, we don't see the kind of borrowing-driven growth that can lead to trouble.
Growth now or growth later?
In my next post, we’ll talk more about the trade-offs between growth now and growth later. As an intro, the 1990s and 2000s are great poster children for the two cases. Right now, we’re more in the slow and steady camp, which I personally prefer. Remember that when you read that the high savings rate is a bad thing. For today, maybe, but certainly not for tomorrow.


