Part of my talk on investing at Commonwealth’s Chairman’s Retreat in Las Vegas was about looking for indicators that could help investors improve their odds. One of the best ways to do so, in my opinion, is to have some idea of when really bad times are coming, so that you can plan for them.
The received wisdom is that you can’t time the market—and that is absolutely correct—but you can get a better idea of what might lie ahead and modify your strategy accordingly. I used the poker hand example the other day, and the question with the stock market is whether there are similar indicators that suggest you should change your strategy. I would argue there are and that, in fact, they’re largely pretty simple.
Moving averages—the average of the closing prices over previous periods—measure how market sentiment (buyers versus sellers) is changing over time. In theory, they provide an indicator of what investors are thinking and how they’re likely to behave. Could moving averages be an indicator worth watching?
The short answer is yes.
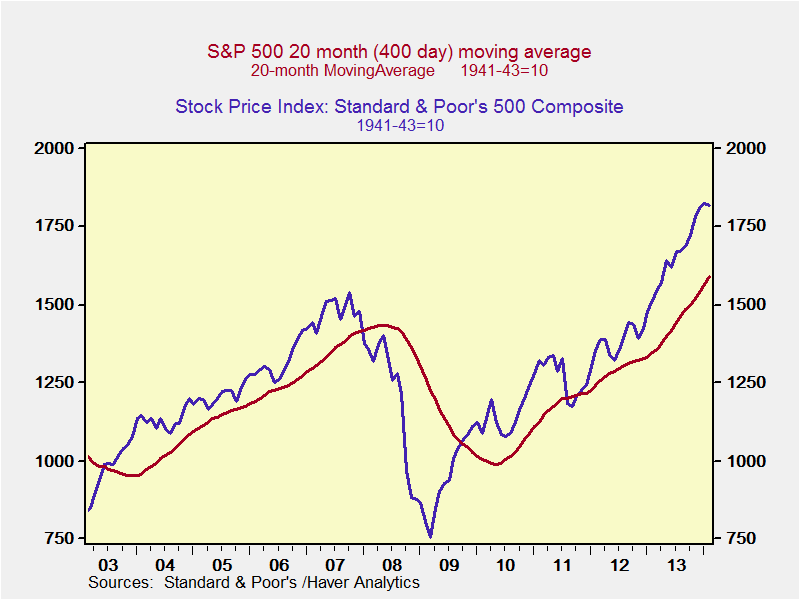
I had a wonderful college physics professor, Bruce Pipes, who was a great proponent of the “method of staring,” an analytical tool I use to this day. If you look at the S&P 500 versus its 200-day moving average, you see that bad things can follow a break, especially in late 2007. (I’m using a 10-month rather than a 200-day average here, because of the data structure in the Haver software, but that doesn’t make a significant difference.)
This is a pretty limited time frame, though, and there are a number of close calls that might lead to a whipsaw. It’s a good metric, but perhaps there is a better one, with fewer ambiguous signals. Let’s look at a longer period—the 20-month, or 400-day, moving average.
This is a much less ambiguous indicator. Over a 10-year period, we see only five signals: a buy in 2003, a sell in 2007/8, a buy in 2009, and a potential whiplash in 2011. Not perfect, but pretty good. What about over an even longer time period?
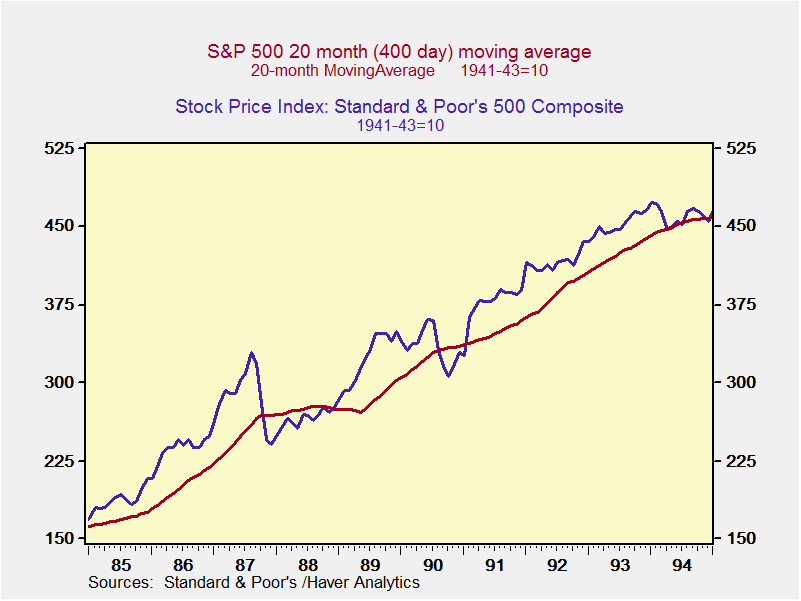
For the 10 preceding years, 1993 through 2003, we see the same effect. Looking more closely at 1994 and 1995, which is difficult to see on the following chart because of the scale, we see some ambiguity, but it is still pretty clear.
These are useful indicators, but they’re not without flaws. As you can see above, for example, this would have done you no good at all in 1987 or in 1990. Longer-term indicators can’t catch sudden, big drawdowns. Fortunately, these are not common, but it is a risk.
The other problem is the tradeoff between the length of the signal—longer means fewer false signals—and the damage that’s done before the signal trips. Shorter signals might get you out sooner but turn out to be false. There’s a balancing act involved that’s difficult to maintain.
The final question becomes, What do I do if a signal trips? That depends on your plan. If you’re a long-term investor, prepared to ride out the decline, possibly nothing. If you’re retiring in a couple of years, or are already retired and don’t want to assume that risk, perhaps you hedge in any of a multiple of ways. In either case, you can improve your odds of success by either limiting your risk or being more prepared mentally.
This is just one way to look at what the market is telling you in an attempt to improve your odds. You might think of it like a form of card counting—and the great thing about the Wall Street casino is that you won’t get thrown out for doing it.


 Print
Print


