I wrote last Friday about the return to political economy, and one of the points I raised there was the breakdown of the consensus on the right form of government, the economy, and the relationship between them.
From a political perspective, we’re seeing this in the increasing polarization and dysfunction in Washington, DC, where the parties can’t seem to agree on what day it is. As I wrote, though, I view this as a symptom rather than a cause. The underlying reasons are economic, and I want to start digging into those today.
The U.S. has always been a middle-class nation—either in actuality or in aspiration. The very idea of the “American dream,” with a house and a car, is a middle-class dream. Although we historically have aspired to be rich, and admired those who were, what the vast majority of the population was working for and achieving was middle-class status.
The first real challenge to this was the Great Depression, when the economy broke and the perceived ability of most people to reach the Dream disappeared. We now tend to forget just how politically difficult the Depression years were. Roosevelt went so far as to threaten to pack the Supreme Court with favorable justices when they obstructed his plans. The New Deal fundamentally restructured, and expanded, the role of the federal government. The list goes on and may sound familiar today.
Post-World War II, the economy seemed to have mended. When we look at the causes of that, though, we find that the U.S. benefited from the almost complete destruction of all of our competitors—Europe and Japan were devastated, China and Russia self-isolated. The U.S. was literally the only game in town, and of course we prospered. The U.S. also drove demand through grants and loans to allies and former foes, essentially using government money to prime the pump.
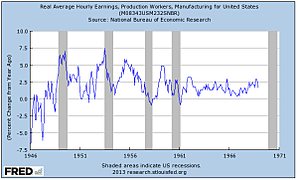
The boom extended through the 1950s, but, in the 1960s and thereafter, the favorable trends changed. Europe and Japan had rebuilt and were now competing with the U.S. It was at this point that income growth leveled out after very strong gains in the 1950s. You can see on the chart below how income growth rates for the average manufacturing worker dropped from the 1950s through the 1960s.
We do see a bump in the late 1960s, as demand from the Vietnam War picked up, but, in general, the decline is clear.
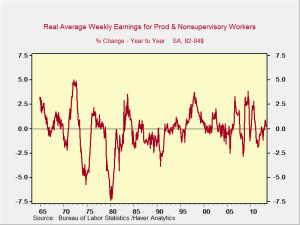
Post-1970—and the reason I’m treating these periods separately is that they are different data series—things got even worse, per the following chart.
Real average weekly earnings dropped significantly in many years, from the 1970s through today, with periods of recovery in economic good times, such as the mid-1990s and early 2000s. Overall, real average earnings have consistently declined over much of the past 50 years. If you look at nominal incomes, the effect is masked by the existence of inflation, but the downward trend is clear.
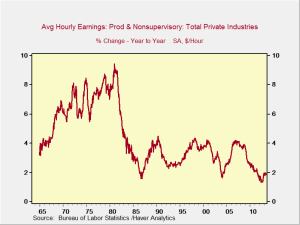
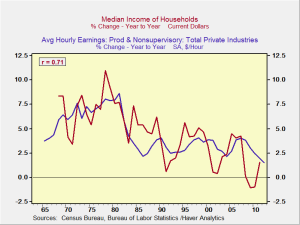
Looking at household income, the same trend appears, but with some interesting differences. First, household income growth is better in good times and worse in bad times. Second, that difference seems to diminish over time.
When you see the difference between average hourly earnings and household income, the question is, why? A big factor is that more and more women joined the workforce during these decades. I say women, but you could also call it the movement of the partner who would typically earn less into the labor force.
You can see that the swing additions to the labor force, which come in during good times and leave in bad, are getting smaller. This is reasonable, as the trend above is now completed. Therefore, it isn’t going to drive future household income growth, even in good times, and may subtract more in bad. The norm is now for both partners to work, so there’s little more to be gained—and more to lose. Also relevant, though, is that growth rates in household income are declining, even in good times.
This means that growth in household income has increasingly been driven by an expansion of the labor force, with two workers per household rather than one. The contribution of the less-qualified partner adds in good times; in bad times, growth is hit harder when he or she can contribute less. Even that added growth factor is running out.
The negative effect of slowing income growth, at both the individual and household level, on most people’s ability to achieve the American dream was exacerbated in the mid-2000s by rising home values. Though a windfall for owners, many were priced out of the market. The pricing problem has been largely corrected since then, but the ability of many families to purchase has remained impaired as lenders are unwilling to lend.
This analysis will run longer than I thought, so I’ll end today with a preliminary conclusion that I will expand on in later posts. Unlike in the Depression, existing government programs have cushioned the blow to people in the lower-income cohorts, but they certainly haven’t eliminated it. Moreover, the larger trends are combining to do just as much damage to the economic and social prospects of these cohorts as the Depression—or the more recent Great Recession—had done.
That damage calls into question the basic social bargain we have in the U.S.—that someone who works hard can achieve the American dream. If we replace the middle-class aspirations of the lower-income cohorts with an absence of realistic hope, their incentive to continue to achieve is eroded at the same time that the existing middle classes, also subject to the same trends, feel under threat. The increasing demands for government support for the lower-income cohorts, and resistance of those demands by the upper-income cohorts, both come from that same source. As long as these trends remain in place, our political dysfunction will continue.


 Print
Print


