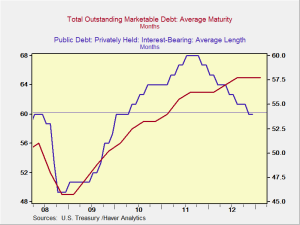
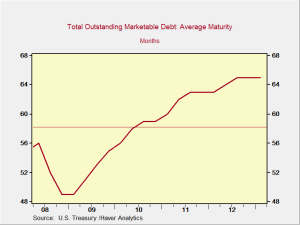
As of the end of 2012, the average maturity of U.S. debt was around five years—65 months to be exact—up considerably from the October 2008 trough, and the longest average maturity in a decade, according to the Wall Street Journal. The Treasury intends to continue extending the maturity, with a goal of around 80 months in 2022.
Why? With shorter-term bonds costing less than longer-term bonds, why not just keep the average maturity as short as possible to minimize debt service costs? The short answer is that the Treasury is planning for the time, which could be reasonably soon, when the Fed stops buying bonds in order to push yields down. The longer the average maturity of the debt, the less the immediate refinancing risk when rates start to rise.
You can compare this to a five-year adjustable-rate mortgage. If you expect rates to rise, you want to lock in your costs for as long as you can. We know rates will rise at some point, so it makes sense to lock in current low costs as far into the future as possible.
To quantify this a bit, as of May 10, 2013, Treasury bond rates stood at 11 basis points for the 1-year, 82 bps for the 5-year, and 190 bps for the 10-year; extending the maturity from 5 years to 10 would cost about another 1 percent. If interest rates for the 5-year and 10-year Treasuries were to increase back to their averages over the past 10 years (266 bps for the 5-year and 348 bps for the 10-year—which are still artificially low, since they include the last 3 years), we would be paying 1 percent to save a potential 1.5 percent. Sticker shock is another factor: 1-year rates would increase by over 15 times (to 176 bps), 5-year rates would more than triple, and 10-year rates would just less than double. We would also face the question of demand shortage as we continuously rolled over short-term debt. Given the demand issue and the potential for payment shock, it makes sense to extend the maturity as much as possible.
Another, less-obvious benefit is that longer terms allow inflation to erode the real value of the debt. As the Fed has explicitly stated that it will create inflation, shorter-term debt would have to be refinanced more quickly—leaving less time for inflation to erode its real value. Longer-term debt allows more time for that to occur. At an inflation rate of 2 percent per year, a 10-year bond would lose 20 percent of its real value over the term. With trillions in overall debt, that’s not trivial.
Looking at the chart below, we see privately held public debt decreasing in maturity while the overall debt maturity increases. Why could that be? Well, with the Fed just rebating interest paid to the Treasury, it’s essentially free debt. Moreover, the Fed won’t be dumping its holdings if interest rates rise, and it will squawk much less at the losses from rising rates. 
In fact, it almost looks as if the Treasury and the Fed are setting up a situation in which the Fed will be able to support a rising level of inflation (and consequent erosion of the real value of the debt) simply by sitting on its holdings, while lessening the effect on other aspects of government finance.
Although I’m not sure about this and want to think it through some more, it does seem that this could be a setup for the Fed exit that would minimize larger economic damage. If so, it’s a very clever strategy.


 Print
Print


