

 Print
Print— Guest post from Peter Essele, CFA®, senior investment research analyst
To assess the riskiness of the highest-yielding area of the bond market relative to that of the equity market, we produced the chart below. The line shows the difference between the average yield for the high-yield market and the average yield for the top 10 percent of securities in the S&P 500. For instance, the current reading of 0.45 is the result of subtracting the average yield of higher-yielding equities (5.33) from the average yield in the high-yield market (5.78).

Source: Bloomberg/Commonwealth Investment Research
On average, the highest-yielding securities in the S&P 500 have been beaten up in price and can be considered relatively “risky” investments, resulting in larger yields than many of the other constituents. Currently, approximately 20 companies in the S&P 500 have 12-month yields in the upper end of the spectrum.
If you look at the chart, it becomes evident that the spread between the two has compressed pretty significantly over the last year and a half, to the point where high-yield is only about 45 basis points above the highest-yielding equities in the S&P—a long way off from the average spread of 400 basis points over the last 25 years. On a tax-adjusted basis, assuming 30 percent tax on interest and 15 percent on dividends, the current yields become 4.91 percent and 4.05 percent, respectively, for equity and high-yield.
It’s an interesting scenario playing out within the fixed income market, as investors seem to be more comfortable buying securities selling at a premium—the average price in the high-yield market is $104, with maturity value of $100—with hardly any possibility of an upside than buying a basket of equities with better after-tax yields and unlimited upside. The prospect of a theoretical maturity value and date coupled with bond-like characteristics is apparently an attractive proposition for investors, even though correlations between these two markets have historically been quite strong, especially in periods of turmoil.
All-time lows on financing, by way of the high-yield market, have kicked the leveraged buyout (LBO) market into high gear as of late. (LBOs are deals in which private equity firms finance the takeover of a public company using little equity and large amounts of debt.) The following chart illustrates why this dynamic is playing out.
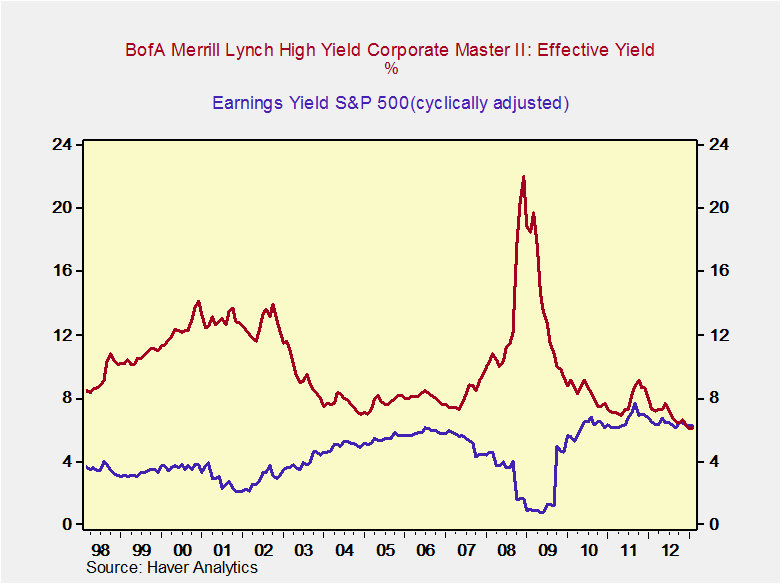
Currently, the earnings yield for S&P 500 companies is above the average yield for the high-yield market. Given current prices, that means a private equity firm could finance a takeover using high-yield debt and effectively receive an earnings yield above the financing charge (i.e., end-of-day earnings are greater than financing expenses). If you incorporate the tax efficiency associated with financing through debt, this dynamic becomes even more compelling for private equity firms. In addition, if firms can issue debt below the high-yield rate, it presents a more attractive picture still. In the last 15 years or so, high-yield debt has yielded well above the earnings yield, but the strong demand for income recently in the high-yield bond market has distorted the historical relationship.
Indices are unmanaged and cannot be invested into directly. Past performance is not indicative of future results.


