A year that investors can celebrate
The S&P 500 Index notched a 16-percent gain for the year. International markets performed even better, as the MSCI EAFE Index returned 17.32 percent and the MSCI Emerging Markets Index rose 15.15 percent. The strong performance of stocks reflected economic recovery in the U.S., political improvements in Europe, and a successful leadership transition and economic “soft landing” in China.
In December, markets fluctuated with news from Washington, DC. At year-end, a small compromise on the fiscal cliff seemed in the making, with an agreement to raise income taxes for households making $450,000 or more annually.
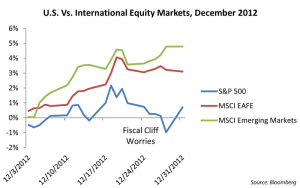
The S&P 500 rose 0.91 percent in December. Midsized companies outperformed large- and small-caps, and value beat growth during the year. Financial and consumer discretionary stocks did best, while the utilities and energy sectors lagged. The strong performance of international markets continued in December, as the MSCI EAFE and MSCI Emerging Markets indices rose 3.2 percent and 4.78 percent, respectively (see chart).
Fixed income markets performed well in 2012, with the Barclays Capital Aggregate Bond Index gaining 4.22 percent for the year and the Barclays Capital U.S. Corporate High Yield Index returning 15.81 percent. High-quality bonds lost ground in December, with the Aggregate Bond Index declining 0.14 percent. Treasuries traded in a relatively narrow range throughout the year.
Valuations vary across asset classes
As we enter 2013, U.S. stocks appear fairly valued based on short-term indicators, such as the trailing 12-month price-to-earnings ratio, but less attractive according to other metrics, such as the Shiller P/E ratio. The most value to be found is in developed Europe and Japan, though emerging market stocks also look attractive, particularly in cyclical sectors.
Bonds appear expensive. High-yields and municipals rallied significantly in 2012. With respect to their spread over Treasuries, they may offer opportunities, but they’re less attractive now than in early 2012.
A slow global economy spurred government intervention
The overarching factor in all markets in 2012 was the influence of governments and central banks. The European Central Bank (ECB) launched its Long-Term Refinancing Operation, and the U.S. Federal Reserve (Fed) continued Operation Twist. Both spurred rallies in risk assets. Later, the ECB announced a willingness to buy sovereign debt of distressed peripheral nations, the Fed promised a third round of quantitative easing, and China and Brazil cut lending rates.
The backdrop for these interventions was a soft global economy. The eurozone fell into mild recession, the Japanese economy struggled, and global manufacturing stagnated. The U.S. economy grew slowly, mostly as a result of an improving housing market and consumer spending.
U.S. housing and consumer spending recover, business lags
Housing slowly improved, with home values increasing year-over-year for the first time since 2006. Inventories remained below historical levels, suggesting that prices would continue to rise, and there were signs that household formation was starting to recover.
Employment also improved. The unemployment rate (U3) dropped from 8.5 percent at the start of the year to 7.7 percent near the end.
Consumer spending moved above the peak of the previous cycle, and though consumer savings rates fell, they remained reasonable. Consumer debt and debt service levels declined to multiyear lows. But business spending was much weaker, driven by uncertainty with respect to taxes and federal spending.
On to 2013
U.S. economic trends look encouraging. The political and economic risks in Europe remain but have been reduced. China and other emerging markets are showing signs of stronger growth.
A major risk for the U.S. is government dysfunction, as a debt ceiling debate approaches. Another risk is the reduced scope of policy responses available to central banks, so investors must rely on individual consumers and businesses to drive the economy forward.
Nevertheless, developments bode reasonably well for markets. In the U.S., the risks are containable and fiscal cliff damage may be limited. Cautious optimism is the appropriate stance. Investors should stay focused on their long-term strategic allocations and goals.
Certain sections of this commentary contain forward-looking statements that are based on our reasonable expectations, estimates, projections, and assumptions. Forward-looking statements are not guarantees of future performance and involve certain risks and uncertainties, which are difficult to predict. Past performance is not indicative of future results. Diversification does not assure a profit or protect against loss in declining markets. All indices are unmanaged and investors cannot invest directly into an index. The S&P 500 Index is a broad-based measurement of changes in stock market conditions based on the average performance of 500 widely held common stocks. The MSCI EAFE Index is a float-adjusted market capitalization index designed to measure developed market equity performance, excluding the U.S. and Canada. The MSCI Emerging Markets Index is a market capitalization-weighted index composed of companies representative of the market structure of 26 emerging market countries in Europe, Latin America, and the Pacific Basin. It excludes closed markets and those shares in otherwise free markets that are not purchasable by foreigners. The Barclays Capital Aggregate Bond Index is an unmanaged market value-weighted index representing securities that are SEC-registered, taxable, and dollar-denominated. It covers the U.S. investment-grade fixed-rate bond market, with index components for a combination of the Barclays Capital government and corporate securities, mortgage-backed pass-through securities, and asset-backed securities. The Barclays Capital U.S. Corporate High Yield Index covers the USD-denominated, non-investment-grade, fixed-rate, taxable corporate bond market. Securities are classified as high-yield if the middle rating of Moody’s, Fitch, and S&P is Ba1/BB+/BB+ or below.


 Print
Print


